Immigrants from Scotland vs Immigrants from Lebanon 3 or more Vehicles in Household
COMPARE
Immigrants from Scotland
Immigrants from Lebanon
3 or more Vehicles in Household
3 or more Vehicles in Household Comparison
Immigrants from Scotland
Immigrants from Lebanon
20.8%
3 OR MORE VEHICLES IN HOUSEHOLD
97.1/ 100
METRIC RATING
108th/ 347
METRIC RANK
19.8%
3 OR MORE VEHICLES IN HOUSEHOLD
67.6/ 100
METRIC RATING
160th/ 347
METRIC RANK
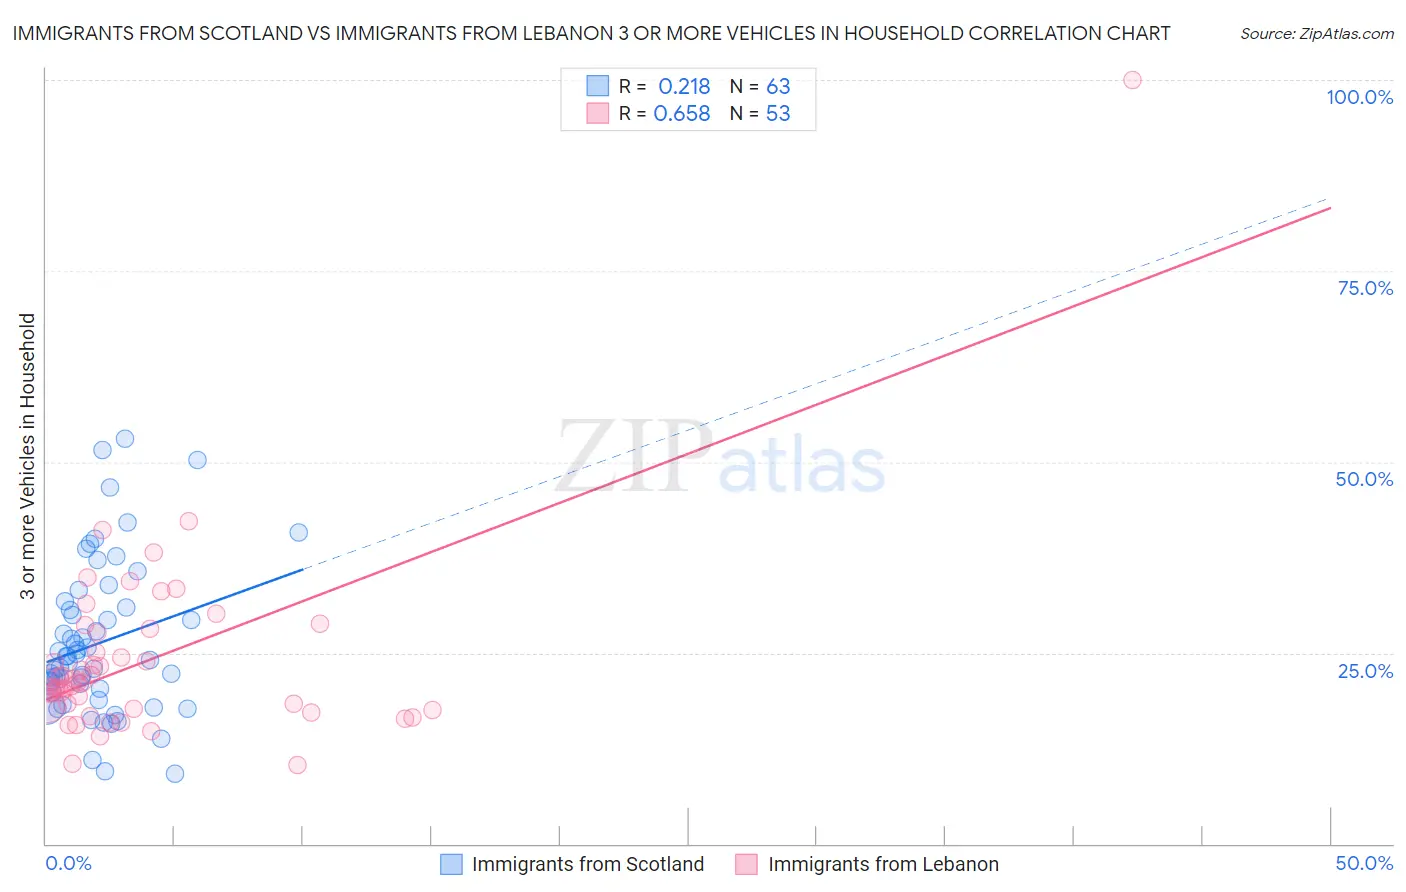
Immigrants from Scotland vs Immigrants from Lebanon 3 or more Vehicles in Household Correlation Chart
The statistical analysis conducted on geographies consisting of 196,362,918 people shows a weak positive correlation between the proportion of Immigrants from Scotland and percentage of households with 3 or more vehicles available in the United States with a correlation coefficient (R) of 0.218 and weighted average of 20.8%. Similarly, the statistical analysis conducted on geographies consisting of 217,088,415 people shows a significant positive correlation between the proportion of Immigrants from Lebanon and percentage of households with 3 or more vehicles available in the United States with a correlation coefficient (R) of 0.658 and weighted average of 19.8%, a difference of 5.2%.
3 or more Vehicles in Household Correlation Summary
| Measurement | Immigrants from Scotland | Immigrants from Lebanon |
| Minimum | 9.1% | 10.3% |
| Maximum | 53.1% | 100.0% |
| Range | 44.0% | 89.7% |
| Mean | 26.2% | 24.1% |
| Median | 24.0% | 21.1% |
| Interquartile 25% (IQ1) | 19.9% | 17.5% |
| Interquartile 75% (IQ3) | 31.0% | 27.9% |
| Interquartile Range (IQR) | 11.1% | 10.4% |
| Standard Deviation (Sample) | 9.9% | 12.8% |
| Standard Deviation (Population) | 9.8% | 12.7% |
Similar Demographics by 3 or more Vehicles in Household
Demographics Similar to Immigrants from Scotland by 3 or more Vehicles in Household
In terms of 3 or more vehicles in household, the demographic groups most similar to Immigrants from Scotland are Filipino (20.8%, a difference of 0.060%), Immigrants from Germany (20.8%, a difference of 0.15%), Bolivian (20.8%, a difference of 0.19%), Asian (20.8%, a difference of 0.20%), and Immigrants from Micronesia (20.7%, a difference of 0.23%).
| Demographics | Rating | Rank | 3 or more Vehicles in Household |
| Blackfeet | 97.9 /100 | #101 | Exceptional 20.9% |
| Seminole | 97.8 /100 | #102 | Exceptional 20.9% |
| Dutch West Indians | 97.8 /100 | #103 | Exceptional 20.9% |
| Luxembourgers | 97.7 /100 | #104 | Exceptional 20.9% |
| Austrians | 97.5 /100 | #105 | Exceptional 20.9% |
| Bolivians | 97.4 /100 | #106 | Exceptional 20.8% |
| Immigrants | Germany | 97.4 /100 | #107 | Exceptional 20.8% |
| Immigrants | Scotland | 97.1 /100 | #108 | Exceptional 20.8% |
| Filipinos | 97.0 /100 | #109 | Exceptional 20.8% |
| Asians | 96.8 /100 | #110 | Exceptional 20.8% |
| Immigrants | Micronesia | 96.7 /100 | #111 | Exceptional 20.7% |
| Nicaraguans | 96.2 /100 | #112 | Exceptional 20.7% |
| Immigrants | England | 96.2 /100 | #113 | Exceptional 20.7% |
| Burmese | 95.8 /100 | #114 | Exceptional 20.6% |
| French Canadians | 95.0 /100 | #115 | Exceptional 20.6% |
Demographics Similar to Immigrants from Lebanon by 3 or more Vehicles in Household
In terms of 3 or more vehicles in household, the demographic groups most similar to Immigrants from Lebanon are Immigrants from Pakistan (19.8%, a difference of 0.050%), Armenian (19.8%, a difference of 0.11%), Immigrants from Guatemala (19.7%, a difference of 0.16%), Hungarian (19.8%, a difference of 0.26%), and Thai (19.8%, a difference of 0.31%).
| Demographics | Rating | Rank | 3 or more Vehicles in Household |
| Yuman | 75.6 /100 | #153 | Good 19.9% |
| Immigrants | Jordan | 75.0 /100 | #154 | Good 19.9% |
| Tlingit-Haida | 73.4 /100 | #155 | Good 19.9% |
| Thais | 71.1 /100 | #156 | Good 19.8% |
| Hungarians | 70.5 /100 | #157 | Good 19.8% |
| Armenians | 68.8 /100 | #158 | Good 19.8% |
| Immigrants | Pakistan | 68.2 /100 | #159 | Good 19.8% |
| Immigrants | Lebanon | 67.6 /100 | #160 | Good 19.8% |
| Immigrants | Guatemala | 65.6 /100 | #161 | Good 19.7% |
| Estonians | 63.2 /100 | #162 | Good 19.7% |
| Chileans | 63.0 /100 | #163 | Good 19.7% |
| Yugoslavians | 62.9 /100 | #164 | Good 19.7% |
| Immigrants | Costa Rica | 61.9 /100 | #165 | Good 19.7% |
| Immigrants | Cameroon | 60.9 /100 | #166 | Good 19.7% |
| Ukrainians | 58.9 /100 | #167 | Average 19.6% |