Immigrants from Scotland vs Immigrants from Kazakhstan 3 or more Vehicles in Household
COMPARE
Immigrants from Scotland
Immigrants from Kazakhstan
3 or more Vehicles in Household
3 or more Vehicles in Household Comparison
Immigrants from Scotland
Immigrants from Kazakhstan
20.8%
3 OR MORE VEHICLES IN HOUSEHOLD
97.1/ 100
METRIC RATING
108th/ 347
METRIC RANK
17.4%
3 OR MORE VEHICLES IN HOUSEHOLD
0.3/ 100
METRIC RATING
279th/ 347
METRIC RANK
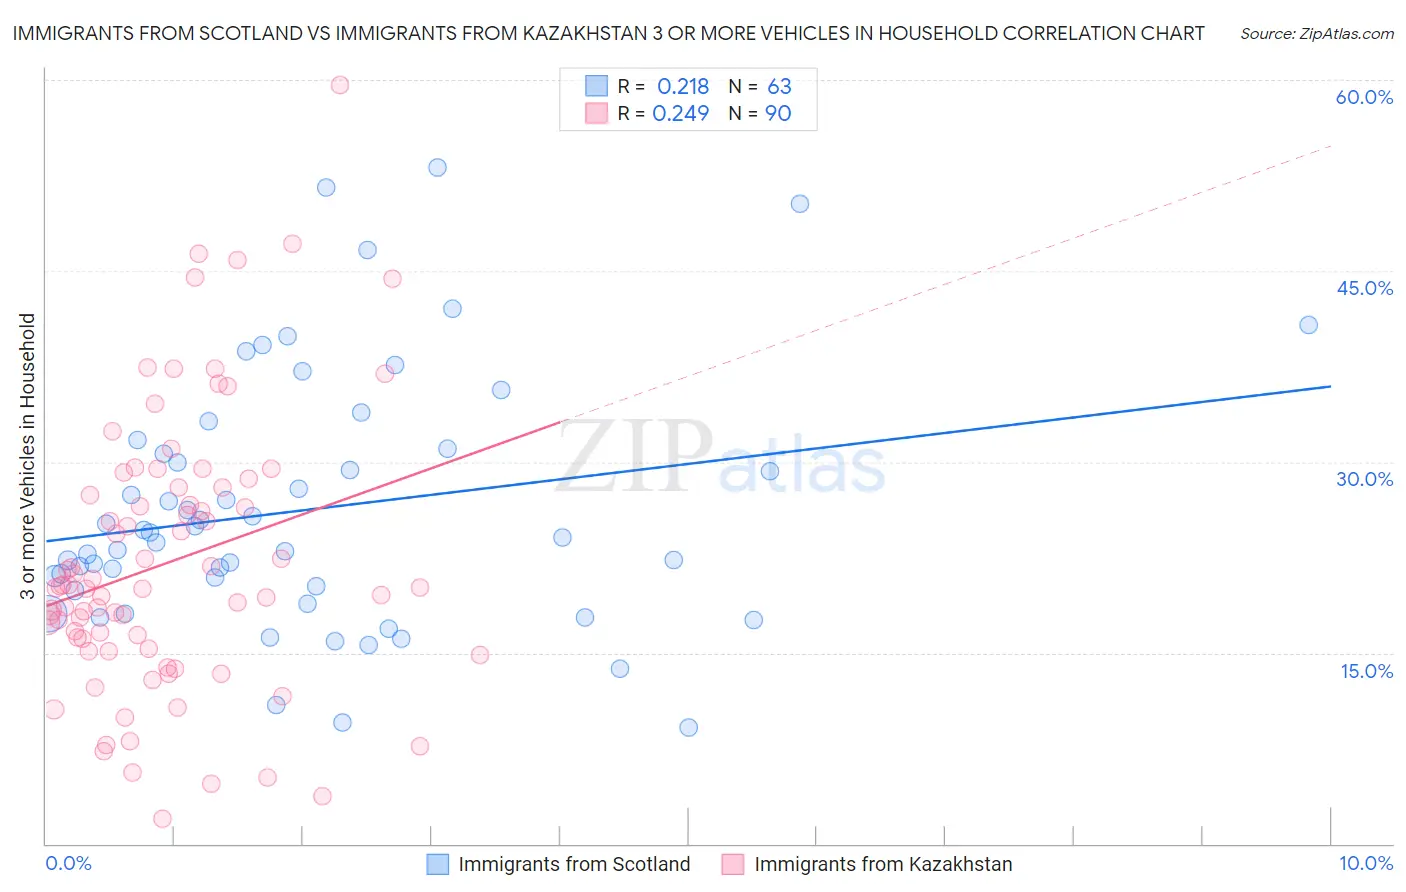
Immigrants from Scotland vs Immigrants from Kazakhstan 3 or more Vehicles in Household Correlation Chart
The statistical analysis conducted on geographies consisting of 196,362,918 people shows a weak positive correlation between the proportion of Immigrants from Scotland and percentage of households with 3 or more vehicles available in the United States with a correlation coefficient (R) of 0.218 and weighted average of 20.8%. Similarly, the statistical analysis conducted on geographies consisting of 124,422,099 people shows a weak positive correlation between the proportion of Immigrants from Kazakhstan and percentage of households with 3 or more vehicles available in the United States with a correlation coefficient (R) of 0.249 and weighted average of 17.4%, a difference of 19.5%.
3 or more Vehicles in Household Correlation Summary
| Measurement | Immigrants from Scotland | Immigrants from Kazakhstan |
| Minimum | 9.1% | 1.9% |
| Maximum | 53.1% | 59.6% |
| Range | 44.0% | 57.7% |
| Mean | 26.2% | 22.1% |
| Median | 24.0% | 20.1% |
| Interquartile 25% (IQ1) | 19.9% | 15.3% |
| Interquartile 75% (IQ3) | 31.0% | 27.9% |
| Interquartile Range (IQR) | 11.1% | 12.7% |
| Standard Deviation (Sample) | 9.9% | 10.8% |
| Standard Deviation (Population) | 9.8% | 10.7% |
Similar Demographics by 3 or more Vehicles in Household
Demographics Similar to Immigrants from Scotland by 3 or more Vehicles in Household
In terms of 3 or more vehicles in household, the demographic groups most similar to Immigrants from Scotland are Filipino (20.8%, a difference of 0.060%), Immigrants from Germany (20.8%, a difference of 0.15%), Bolivian (20.8%, a difference of 0.19%), Asian (20.8%, a difference of 0.20%), and Immigrants from Micronesia (20.7%, a difference of 0.23%).
| Demographics | Rating | Rank | 3 or more Vehicles in Household |
| Blackfeet | 97.9 /100 | #101 | Exceptional 20.9% |
| Seminole | 97.8 /100 | #102 | Exceptional 20.9% |
| Dutch West Indians | 97.8 /100 | #103 | Exceptional 20.9% |
| Luxembourgers | 97.7 /100 | #104 | Exceptional 20.9% |
| Austrians | 97.5 /100 | #105 | Exceptional 20.9% |
| Bolivians | 97.4 /100 | #106 | Exceptional 20.8% |
| Immigrants | Germany | 97.4 /100 | #107 | Exceptional 20.8% |
| Immigrants | Scotland | 97.1 /100 | #108 | Exceptional 20.8% |
| Filipinos | 97.0 /100 | #109 | Exceptional 20.8% |
| Asians | 96.8 /100 | #110 | Exceptional 20.8% |
| Immigrants | Micronesia | 96.7 /100 | #111 | Exceptional 20.7% |
| Nicaraguans | 96.2 /100 | #112 | Exceptional 20.7% |
| Immigrants | England | 96.2 /100 | #113 | Exceptional 20.7% |
| Burmese | 95.8 /100 | #114 | Exceptional 20.6% |
| French Canadians | 95.0 /100 | #115 | Exceptional 20.6% |
Demographics Similar to Immigrants from Kazakhstan by 3 or more Vehicles in Household
In terms of 3 or more vehicles in household, the demographic groups most similar to Immigrants from Kazakhstan are Immigrants from Bahamas (17.4%, a difference of 0.010%), Immigrants from Eastern Europe (17.4%, a difference of 0.040%), Immigrants from Latvia (17.4%, a difference of 0.080%), Brazilian (17.4%, a difference of 0.10%), and Okinawan (17.4%, a difference of 0.25%).
| Demographics | Rating | Rank | 3 or more Vehicles in Household |
| Immigrants | Africa | 0.5 /100 | #272 | Tragic 17.6% |
| Immigrants | Sudan | 0.5 /100 | #273 | Tragic 17.6% |
| Immigrants | Bosnia and Herzegovina | 0.5 /100 | #274 | Tragic 17.5% |
| Immigrants | Ukraine | 0.4 /100 | #275 | Tragic 17.5% |
| Okinawans | 0.4 /100 | #276 | Tragic 17.4% |
| Brazilians | 0.4 /100 | #277 | Tragic 17.4% |
| Immigrants | Bahamas | 0.3 /100 | #278 | Tragic 17.4% |
| Immigrants | Kazakhstan | 0.3 /100 | #279 | Tragic 17.4% |
| Immigrants | Eastern Europe | 0.3 /100 | #280 | Tragic 17.4% |
| Immigrants | Latvia | 0.3 /100 | #281 | Tragic 17.4% |
| Immigrants | Ireland | 0.3 /100 | #282 | Tragic 17.3% |
| Blacks/African Americans | 0.3 /100 | #283 | Tragic 17.3% |
| Immigrants | Colombia | 0.3 /100 | #284 | Tragic 17.3% |
| Immigrants | Croatia | 0.2 /100 | #285 | Tragic 17.2% |
| Menominee | 0.2 /100 | #286 | Tragic 17.2% |