Cuban vs Venezuelan 3 or more Vehicles in Household
COMPARE
Cuban
Venezuelan
3 or more Vehicles in Household
3 or more Vehicles in Household Comparison
Cubans
Venezuelans
19.3%
3 OR MORE VEHICLES IN HOUSEHOLD
36.6/ 100
METRIC RATING
182nd/ 347
METRIC RANK
18.0%
3 OR MORE VEHICLES IN HOUSEHOLD
1.7/ 100
METRIC RATING
250th/ 347
METRIC RANK
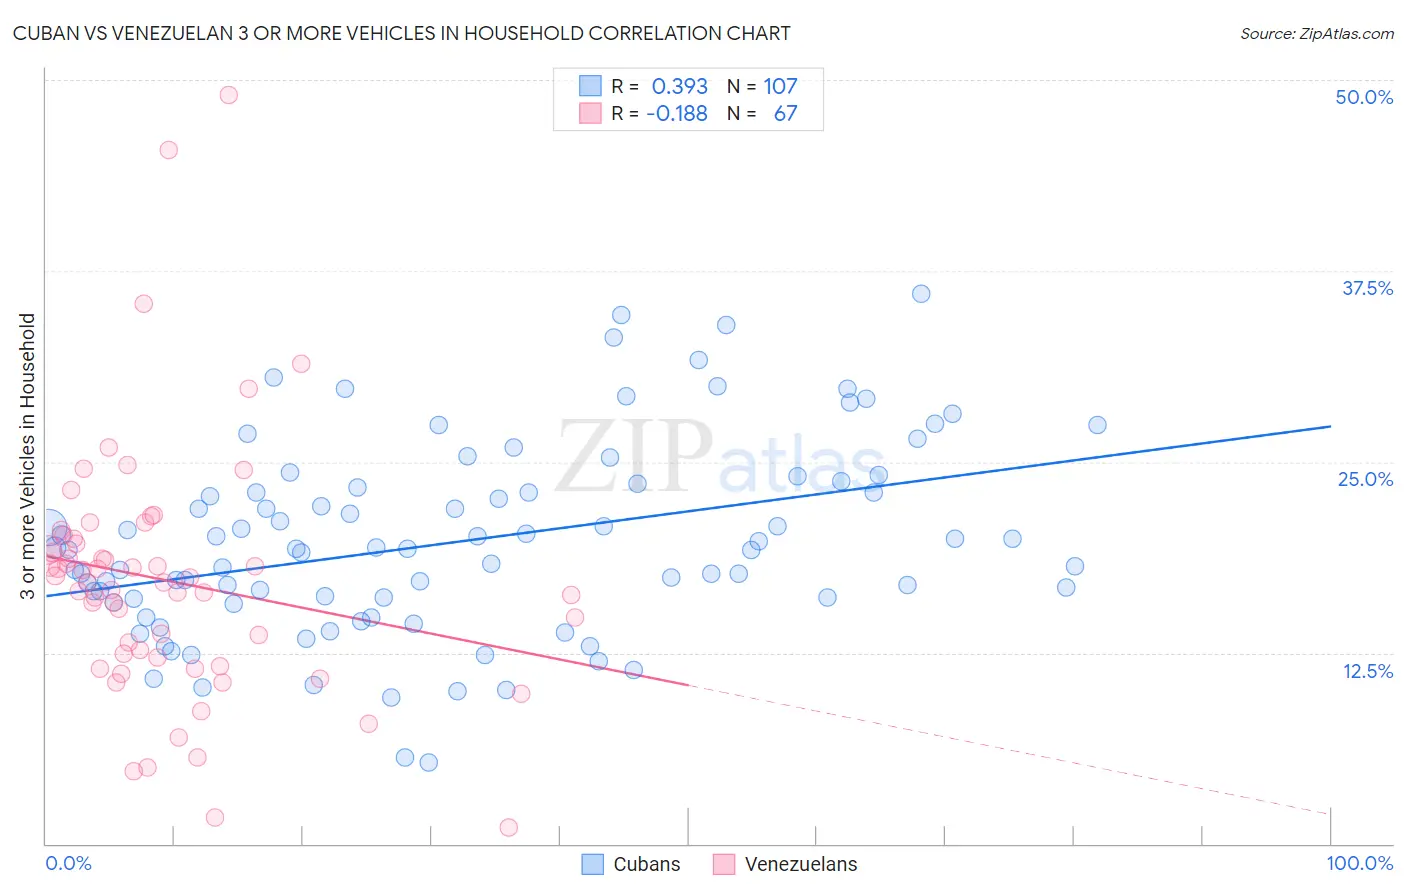
Cuban vs Venezuelan 3 or more Vehicles in Household Correlation Chart
The statistical analysis conducted on geographies consisting of 448,802,841 people shows a mild positive correlation between the proportion of Cubans and percentage of households with 3 or more vehicles available in the United States with a correlation coefficient (R) of 0.393 and weighted average of 19.3%. Similarly, the statistical analysis conducted on geographies consisting of 306,053,229 people shows a poor negative correlation between the proportion of Venezuelans and percentage of households with 3 or more vehicles available in the United States with a correlation coefficient (R) of -0.188 and weighted average of 18.0%, a difference of 7.2%.
3 or more Vehicles in Household Correlation Summary
| Measurement | Cuban | Venezuelan |
| Minimum | 5.3% | 1.1% |
| Maximum | 36.0% | 49.0% |
| Range | 30.7% | 47.9% |
| Mean | 19.8% | 17.2% |
| Median | 19.3% | 17.1% |
| Interquartile 25% (IQ1) | 16.0% | 12.2% |
| Interquartile 75% (IQ3) | 23.3% | 20.0% |
| Interquartile Range (IQR) | 7.3% | 7.8% |
| Standard Deviation (Sample) | 6.3% | 8.3% |
| Standard Deviation (Population) | 6.2% | 8.2% |
Similar Demographics by 3 or more Vehicles in Household
Demographics Similar to Cubans by 3 or more Vehicles in Household
In terms of 3 or more vehicles in household, the demographic groups most similar to Cubans are Romanian (19.3%, a difference of 0.040%), Cajun (19.3%, a difference of 0.050%), South African (19.3%, a difference of 0.070%), Latvian (19.3%, a difference of 0.070%), and Immigrants from South Central Asia (19.3%, a difference of 0.19%).
| Demographics | Rating | Rank | 3 or more Vehicles in Household |
| Syrians | 47.0 /100 | #175 | Average 19.5% |
| Iroquois | 46.0 /100 | #176 | Average 19.4% |
| Immigrants | Peru | 41.1 /100 | #177 | Average 19.4% |
| Immigrants | Syria | 40.3 /100 | #178 | Average 19.4% |
| Immigrants | South Central Asia | 38.9 /100 | #179 | Fair 19.3% |
| South Africans | 37.5 /100 | #180 | Fair 19.3% |
| Romanians | 37.1 /100 | #181 | Fair 19.3% |
| Cubans | 36.6 /100 | #182 | Fair 19.3% |
| Cajuns | 36.0 /100 | #183 | Fair 19.3% |
| Latvians | 35.7 /100 | #184 | Fair 19.3% |
| Immigrants | Sri Lanka | 30.7 /100 | #185 | Fair 19.2% |
| Immigrants | Sweden | 29.0 /100 | #186 | Fair 19.2% |
| Immigrants | Hong Kong | 28.3 /100 | #187 | Fair 19.2% |
| Immigrants | Kuwait | 26.1 /100 | #188 | Fair 19.1% |
| Indians (Asian) | 26.0 /100 | #189 | Fair 19.1% |
Demographics Similar to Venezuelans by 3 or more Vehicles in Household
In terms of 3 or more vehicles in household, the demographic groups most similar to Venezuelans are Immigrants from Saudi Arabia (18.0%, a difference of 0.020%), Immigrants from Eastern Africa (18.0%, a difference of 0.080%), Alsatian (18.0%, a difference of 0.20%), Carpatho Rusyn (18.0%, a difference of 0.21%), and Immigrants from Australia (18.1%, a difference of 0.37%).
| Demographics | Rating | Rank | 3 or more Vehicles in Household |
| Immigrants | Europe | 2.4 /100 | #243 | Tragic 18.1% |
| Mongolians | 2.3 /100 | #244 | Tragic 18.1% |
| Immigrants | Belize | 2.1 /100 | #245 | Tragic 18.1% |
| Immigrants | Australia | 2.0 /100 | #246 | Tragic 18.1% |
| Carpatho Rusyns | 1.9 /100 | #247 | Tragic 18.0% |
| Immigrants | Eastern Africa | 1.8 /100 | #248 | Tragic 18.0% |
| Immigrants | Saudi Arabia | 1.7 /100 | #249 | Tragic 18.0% |
| Venezuelans | 1.7 /100 | #250 | Tragic 18.0% |
| Alsatians | 1.5 /100 | #251 | Tragic 18.0% |
| Immigrants | Southern Europe | 1.4 /100 | #252 | Tragic 17.9% |
| Immigrants | Ethiopia | 1.3 /100 | #253 | Tragic 17.9% |
| Ethiopians | 1.2 /100 | #254 | Tragic 17.9% |
| Immigrants | Turkey | 1.2 /100 | #255 | Tragic 17.9% |
| Sub-Saharan Africans | 1.1 /100 | #256 | Tragic 17.9% |
| Immigrants | Eritrea | 1.1 /100 | #257 | Tragic 17.8% |