Immigrants from Scotland vs Venezuelan Householder Income Ages 25 - 44 years
COMPARE
Immigrants from Scotland
Venezuelan
Householder Income Ages 25 - 44 years
Householder Income Ages 25 - 44 years Comparison
Immigrants from Scotland
Venezuelans
$105,089
HOUSEHOLDER INCOME AGES 25 - 44 YEARS
99.7/ 100
METRIC RATING
63rd/ 347
METRIC RANK
$88,232
HOUSEHOLDER INCOME AGES 25 - 44 YEARS
2.9/ 100
METRIC RATING
234th/ 347
METRIC RANK
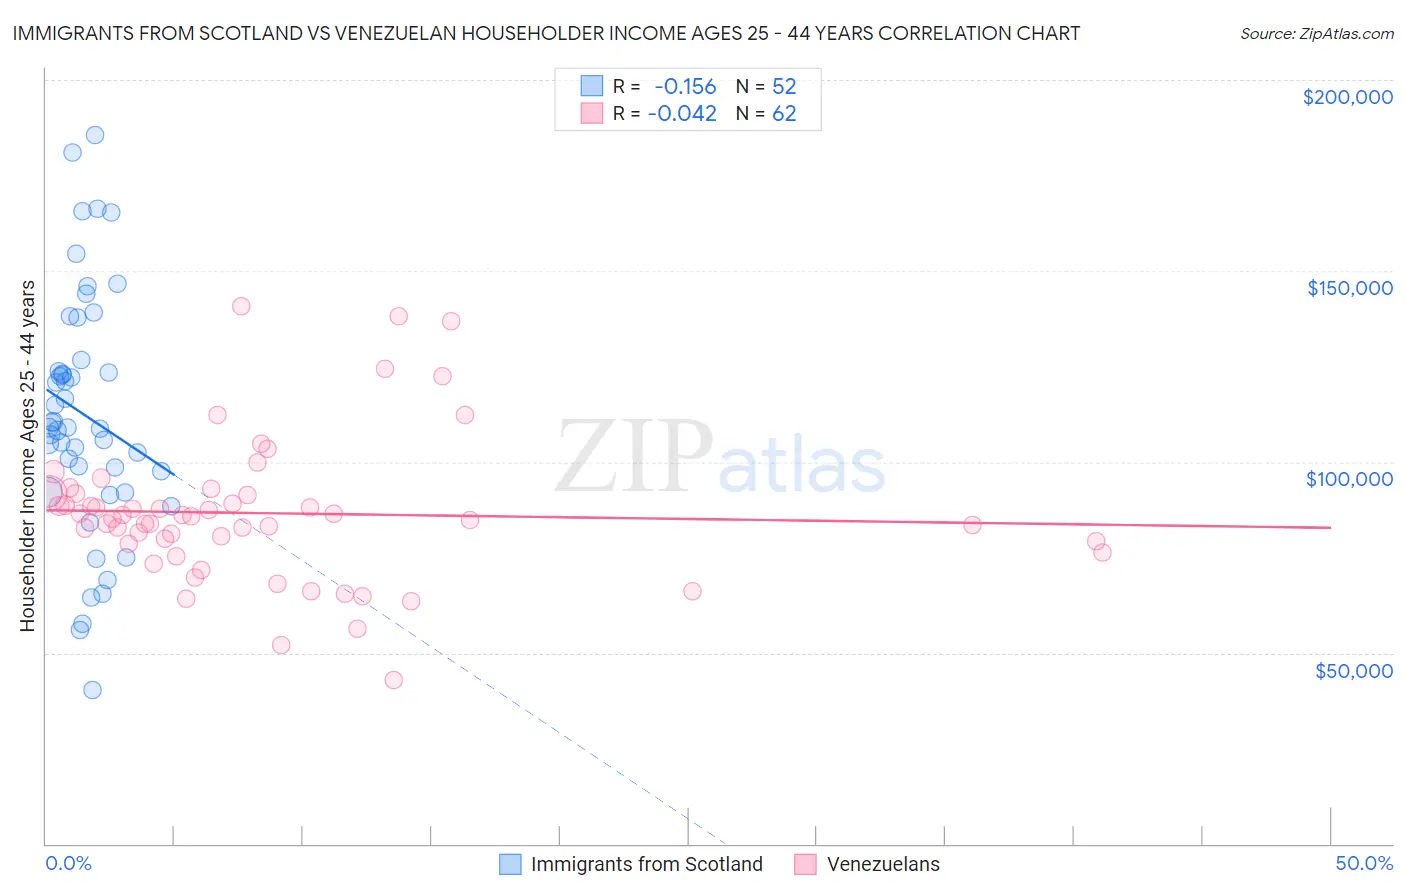
Immigrants from Scotland vs Venezuelan Householder Income Ages 25 - 44 years Correlation Chart
The statistical analysis conducted on geographies consisting of 196,028,874 people shows a poor negative correlation between the proportion of Immigrants from Scotland and household income with householder between the ages 25 and 44 in the United States with a correlation coefficient (R) of -0.156 and weighted average of $105,089. Similarly, the statistical analysis conducted on geographies consisting of 305,747,877 people shows no correlation between the proportion of Venezuelans and household income with householder between the ages 25 and 44 in the United States with a correlation coefficient (R) of -0.042 and weighted average of $88,232, a difference of 19.1%.
Householder Income Ages 25 - 44 years Correlation Summary
| Measurement | Immigrants from Scotland | Venezuelan |
| Minimum | $40,208 | $42,793 |
| Maximum | $185,630 | $140,677 |
| Range | $145,422 | $97,884 |
| Mean | $112,259 | $86,559 |
| Median | $108,926 | $85,482 |
| Interquartile 25% (IQ1) | $94,857 | $78,670 |
| Interquartile 75% (IQ3) | $125,232 | $91,500 |
| Interquartile Range (IQR) | $30,375 | $12,831 |
| Standard Deviation (Sample) | $31,667 | $18,862 |
| Standard Deviation (Population) | $31,361 | $18,709 |
Similar Demographics by Householder Income Ages 25 - 44 years
Demographics Similar to Immigrants from Scotland by Householder Income Ages 25 - 44 years
In terms of householder income ages 25 - 44 years, the demographic groups most similar to Immigrants from Scotland are New Zealander ($105,085, a difference of 0.0%), Immigrants from Netherlands ($105,082, a difference of 0.010%), Laotian ($104,993, a difference of 0.090%), Immigrants from Italy ($105,201, a difference of 0.11%), and Lithuanian ($105,223, a difference of 0.13%).
| Demographics | Rating | Rank | Householder Income Ages 25 - 44 years |
| Immigrants | Pakistan | 99.8 /100 | #56 | Exceptional $106,129 |
| Immigrants | Austria | 99.8 /100 | #57 | Exceptional $106,103 |
| Immigrants | South Africa | 99.8 /100 | #58 | Exceptional $105,748 |
| Immigrants | Latvia | 99.8 /100 | #59 | Exceptional $105,522 |
| Egyptians | 99.7 /100 | #60 | Exceptional $105,282 |
| Lithuanians | 99.7 /100 | #61 | Exceptional $105,223 |
| Immigrants | Italy | 99.7 /100 | #62 | Exceptional $105,201 |
| Immigrants | Scotland | 99.7 /100 | #63 | Exceptional $105,089 |
| New Zealanders | 99.7 /100 | #64 | Exceptional $105,085 |
| Immigrants | Netherlands | 99.7 /100 | #65 | Exceptional $105,082 |
| Laotians | 99.7 /100 | #66 | Exceptional $104,993 |
| Immigrants | Romania | 99.6 /100 | #67 | Exceptional $104,713 |
| Immigrants | Eastern Europe | 99.6 /100 | #68 | Exceptional $104,662 |
| Mongolians | 99.6 /100 | #69 | Exceptional $104,578 |
| Immigrants | Croatia | 99.6 /100 | #70 | Exceptional $104,503 |
Demographics Similar to Venezuelans by Householder Income Ages 25 - 44 years
In terms of householder income ages 25 - 44 years, the demographic groups most similar to Venezuelans are Bermudan ($88,231, a difference of 0.0%), Immigrants from Cameroon ($88,214, a difference of 0.020%), Salvadoran ($88,198, a difference of 0.040%), Malaysian ($88,291, a difference of 0.070%), and Nonimmigrants ($88,301, a difference of 0.080%).
| Demographics | Rating | Rank | Householder Income Ages 25 - 44 years |
| Immigrants | St. Vincent and the Grenadines | 4.1 /100 | #227 | Tragic $88,888 |
| Immigrants | Bosnia and Herzegovina | 4.0 /100 | #228 | Tragic $88,819 |
| Immigrants | Barbados | 3.7 /100 | #229 | Tragic $88,687 |
| Alaskan Athabascans | 3.3 /100 | #230 | Tragic $88,446 |
| Immigrants | Grenada | 3.0 /100 | #231 | Tragic $88,311 |
| Immigrants | Nonimmigrants | 3.0 /100 | #232 | Tragic $88,301 |
| Malaysians | 3.0 /100 | #233 | Tragic $88,291 |
| Venezuelans | 2.9 /100 | #234 | Tragic $88,232 |
| Bermudans | 2.9 /100 | #235 | Tragic $88,231 |
| Immigrants | Cameroon | 2.9 /100 | #236 | Tragic $88,214 |
| Salvadorans | 2.8 /100 | #237 | Tragic $88,198 |
| Alaska Natives | 2.6 /100 | #238 | Tragic $88,018 |
| Immigrants | Ghana | 2.2 /100 | #239 | Tragic $87,760 |
| Nicaraguans | 2.2 /100 | #240 | Tragic $87,751 |
| Nigerians | 2.2 /100 | #241 | Tragic $87,730 |