Creek vs Immigrants from Zaire 3 or more Vehicles in Household
COMPARE
Creek
Immigrants from Zaire
3 or more Vehicles in Household
3 or more Vehicles in Household Comparison
Creek
Immigrants from Zaire
21.9%
3 OR MORE VEHICLES IN HOUSEHOLD
99.9/ 100
METRIC RATING
69th/ 347
METRIC RANK
16.7%
3 OR MORE VEHICLES IN HOUSEHOLD
0.1/ 100
METRIC RATING
298th/ 347
METRIC RANK
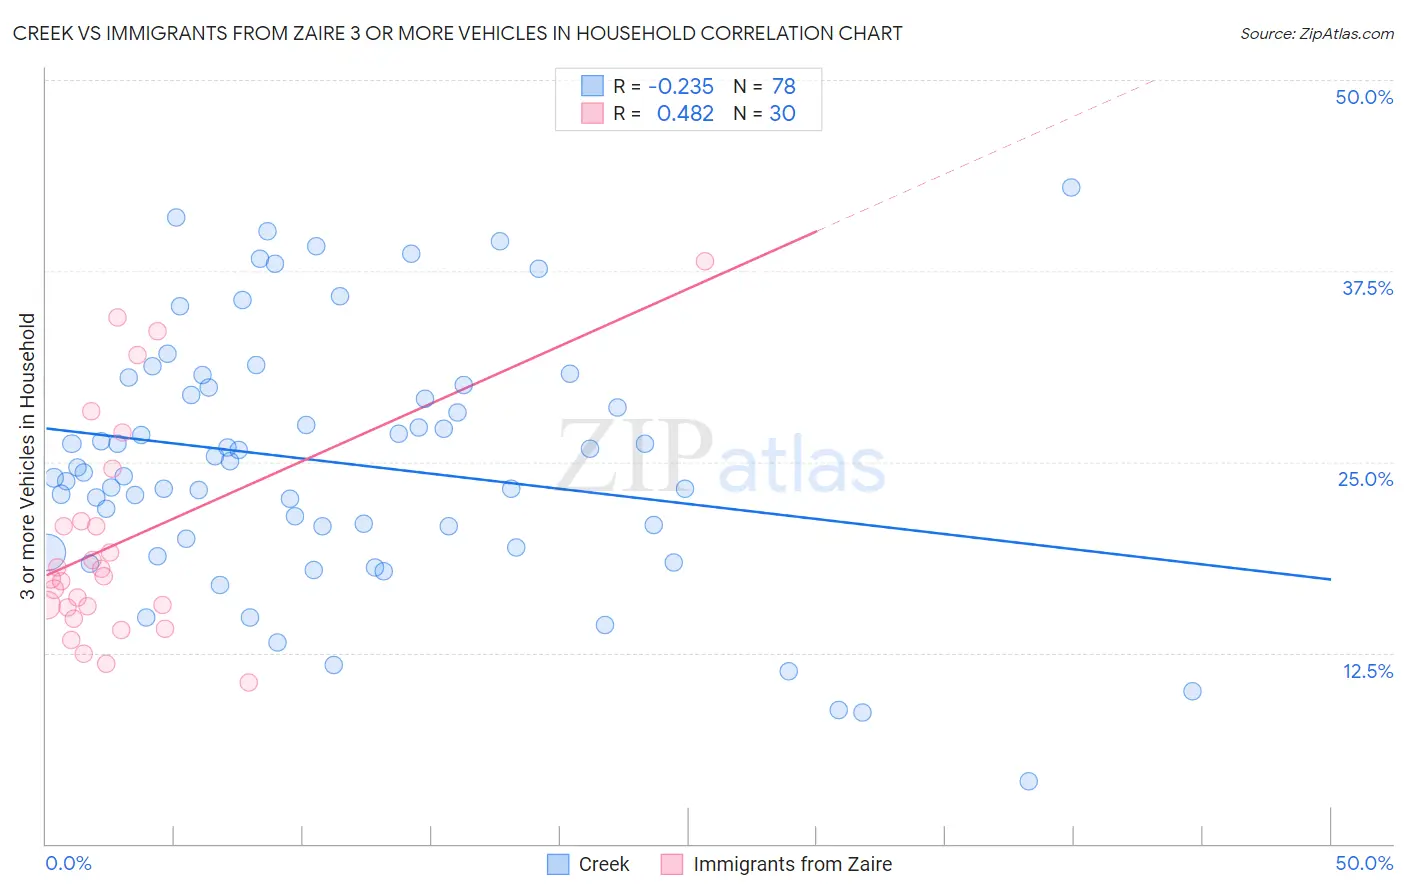
Creek vs Immigrants from Zaire 3 or more Vehicles in Household Correlation Chart
The statistical analysis conducted on geographies consisting of 178,435,403 people shows a weak negative correlation between the proportion of Creek and percentage of households with 3 or more vehicles available in the United States with a correlation coefficient (R) of -0.235 and weighted average of 21.9%. Similarly, the statistical analysis conducted on geographies consisting of 107,239,583 people shows a moderate positive correlation between the proportion of Immigrants from Zaire and percentage of households with 3 or more vehicles available in the United States with a correlation coefficient (R) of 0.482 and weighted average of 16.7%, a difference of 31.1%.
3 or more Vehicles in Household Correlation Summary
| Measurement | Creek | Immigrants from Zaire |
| Minimum | 4.1% | 10.6% |
| Maximum | 43.0% | 38.1% |
| Range | 38.9% | 27.5% |
| Mean | 24.9% | 19.8% |
| Median | 24.5% | 17.5% |
| Interquartile 25% (IQ1) | 20.0% | 15.4% |
| Interquartile 75% (IQ3) | 29.9% | 21.1% |
| Interquartile Range (IQR) | 9.9% | 5.7% |
| Standard Deviation (Sample) | 8.2% | 7.2% |
| Standard Deviation (Population) | 8.2% | 7.1% |
Similar Demographics by 3 or more Vehicles in Household
Demographics Similar to Creek by 3 or more Vehicles in Household
In terms of 3 or more vehicles in household, the demographic groups most similar to Creek are British (21.9%, a difference of 0.030%), Alaskan Athabascan (21.9%, a difference of 0.18%), Bangladeshi (21.9%, a difference of 0.19%), Potawatomi (21.9%, a difference of 0.20%), and Portuguese (21.8%, a difference of 0.38%).
| Demographics | Rating | Rank | 3 or more Vehicles in Household |
| Fijians | 99.9 /100 | #62 | Exceptional 22.2% |
| Chickasaw | 99.9 /100 | #63 | Exceptional 22.2% |
| Immigrants | Taiwan | 99.9 /100 | #64 | Exceptional 22.1% |
| Pima | 99.9 /100 | #65 | Exceptional 22.0% |
| Northern Europeans | 99.9 /100 | #66 | Exceptional 22.0% |
| Alaskan Athabascans | 99.9 /100 | #67 | Exceptional 21.9% |
| British | 99.9 /100 | #68 | Exceptional 21.9% |
| Creek | 99.9 /100 | #69 | Exceptional 21.9% |
| Bangladeshis | 99.8 /100 | #70 | Exceptional 21.9% |
| Potawatomi | 99.8 /100 | #71 | Exceptional 21.9% |
| Portuguese | 99.8 /100 | #72 | Exceptional 21.8% |
| Salvadorans | 99.8 /100 | #73 | Exceptional 21.8% |
| Immigrants | Oceania | 99.8 /100 | #74 | Exceptional 21.8% |
| Japanese | 99.8 /100 | #75 | Exceptional 21.8% |
| Immigrants | Nonimmigrants | 99.8 /100 | #76 | Exceptional 21.8% |
Demographics Similar to Immigrants from Zaire by 3 or more Vehicles in Household
In terms of 3 or more vehicles in household, the demographic groups most similar to Immigrants from Zaire are Immigrants from South America (16.7%, a difference of 0.060%), Israeli (16.8%, a difference of 0.37%), Cypriot (16.6%, a difference of 0.54%), Inupiat (16.9%, a difference of 0.84%), and Paraguayan (16.6%, a difference of 0.95%).
| Demographics | Rating | Rank | 3 or more Vehicles in Household |
| Immigrants | Congo | 0.1 /100 | #291 | Tragic 17.0% |
| Immigrants | Spain | 0.1 /100 | #292 | Tragic 17.0% |
| Bahamians | 0.1 /100 | #293 | Tragic 16.9% |
| Immigrants | Western Africa | 0.1 /100 | #294 | Tragic 16.9% |
| Immigrants | Russia | 0.1 /100 | #295 | Tragic 16.9% |
| Inupiat | 0.1 /100 | #296 | Tragic 16.9% |
| Israelis | 0.1 /100 | #297 | Tragic 16.8% |
| Immigrants | Zaire | 0.1 /100 | #298 | Tragic 16.7% |
| Immigrants | South America | 0.1 /100 | #299 | Tragic 16.7% |
| Cypriots | 0.0 /100 | #300 | Tragic 16.6% |
| Paraguayans | 0.0 /100 | #301 | Tragic 16.6% |
| Immigrants | Greece | 0.0 /100 | #302 | Tragic 16.5% |
| Immigrants | Serbia | 0.0 /100 | #303 | Tragic 16.4% |
| Ghanaians | 0.0 /100 | #304 | Tragic 16.4% |
| Immigrants | Morocco | 0.0 /100 | #305 | Tragic 16.3% |