American vs Immigrants from Zaire 3 or more Vehicles in Household
COMPARE
American
Immigrants from Zaire
3 or more Vehicles in Household
3 or more Vehicles in Household Comparison
Americans
Immigrants from Zaire
22.6%
3 OR MORE VEHICLES IN HOUSEHOLD
100.0/ 100
METRIC RATING
46th/ 347
METRIC RANK
16.7%
3 OR MORE VEHICLES IN HOUSEHOLD
0.1/ 100
METRIC RATING
298th/ 347
METRIC RANK
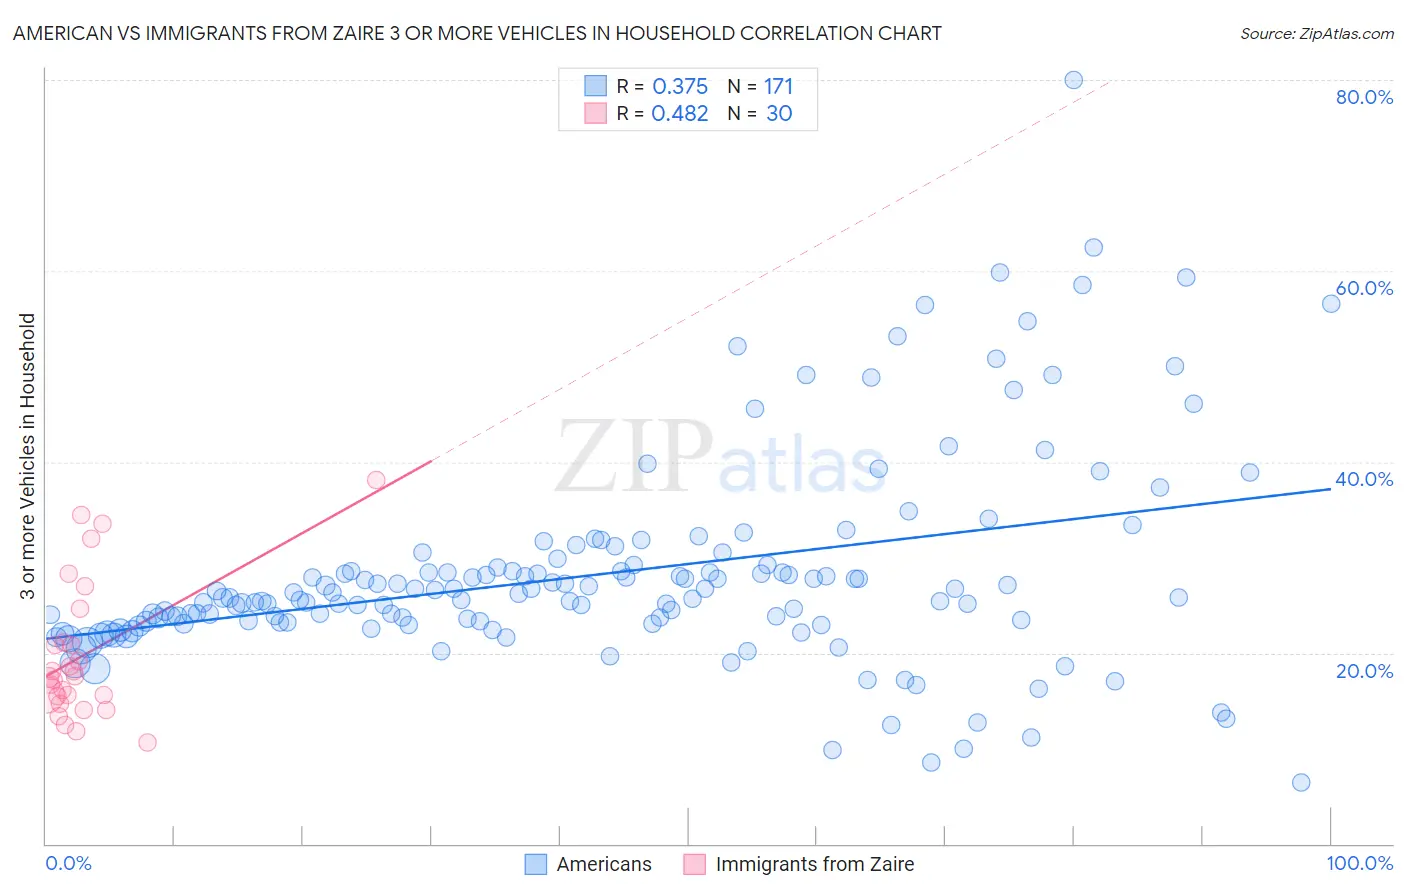
American vs Immigrants from Zaire 3 or more Vehicles in Household Correlation Chart
The statistical analysis conducted on geographies consisting of 581,030,597 people shows a mild positive correlation between the proportion of Americans and percentage of households with 3 or more vehicles available in the United States with a correlation coefficient (R) of 0.375 and weighted average of 22.6%. Similarly, the statistical analysis conducted on geographies consisting of 107,239,583 people shows a moderate positive correlation between the proportion of Immigrants from Zaire and percentage of households with 3 or more vehicles available in the United States with a correlation coefficient (R) of 0.482 and weighted average of 16.7%, a difference of 35.4%.
3 or more Vehicles in Household Correlation Summary
| Measurement | American | Immigrants from Zaire |
| Minimum | 6.4% | 10.6% |
| Maximum | 80.0% | 38.1% |
| Range | 73.6% | 27.5% |
| Mean | 28.3% | 19.8% |
| Median | 25.8% | 17.5% |
| Interquartile 25% (IQ1) | 23.2% | 15.4% |
| Interquartile 75% (IQ3) | 29.0% | 21.1% |
| Interquartile Range (IQR) | 5.8% | 5.7% |
| Standard Deviation (Sample) | 10.9% | 7.2% |
| Standard Deviation (Population) | 10.9% | 7.1% |
Similar Demographics by 3 or more Vehicles in Household
Demographics Similar to Americans by 3 or more Vehicles in Household
In terms of 3 or more vehicles in household, the demographic groups most similar to Americans are Malaysian (22.6%, a difference of 0.010%), Scottish (22.6%, a difference of 0.020%), Scotch-Irish (22.6%, a difference of 0.12%), Sioux (22.6%, a difference of 0.18%), and Ute (22.7%, a difference of 0.19%).
| Demographics | Rating | Rank | 3 or more Vehicles in Household |
| Yaqui | 100.0 /100 | #39 | Exceptional 22.9% |
| Europeans | 100.0 /100 | #40 | Exceptional 22.9% |
| Germans | 100.0 /100 | #41 | Exceptional 22.7% |
| Natives/Alaskans | 100.0 /100 | #42 | Exceptional 22.7% |
| Osage | 100.0 /100 | #43 | Exceptional 22.7% |
| Cheyenne | 100.0 /100 | #44 | Exceptional 22.7% |
| Ute | 100.0 /100 | #45 | Exceptional 22.7% |
| Americans | 100.0 /100 | #46 | Exceptional 22.6% |
| Malaysians | 100.0 /100 | #47 | Exceptional 22.6% |
| Scottish | 100.0 /100 | #48 | Exceptional 22.6% |
| Scotch-Irish | 100.0 /100 | #49 | Exceptional 22.6% |
| Sioux | 100.0 /100 | #50 | Exceptional 22.6% |
| Whites/Caucasians | 100.0 /100 | #51 | Exceptional 22.6% |
| Welsh | 100.0 /100 | #52 | Exceptional 22.6% |
| Czechs | 100.0 /100 | #53 | Exceptional 22.5% |
Demographics Similar to Immigrants from Zaire by 3 or more Vehicles in Household
In terms of 3 or more vehicles in household, the demographic groups most similar to Immigrants from Zaire are Immigrants from South America (16.7%, a difference of 0.060%), Israeli (16.8%, a difference of 0.37%), Cypriot (16.6%, a difference of 0.54%), Inupiat (16.9%, a difference of 0.84%), and Paraguayan (16.6%, a difference of 0.95%).
| Demographics | Rating | Rank | 3 or more Vehicles in Household |
| Immigrants | Congo | 0.1 /100 | #291 | Tragic 17.0% |
| Immigrants | Spain | 0.1 /100 | #292 | Tragic 17.0% |
| Bahamians | 0.1 /100 | #293 | Tragic 16.9% |
| Immigrants | Western Africa | 0.1 /100 | #294 | Tragic 16.9% |
| Immigrants | Russia | 0.1 /100 | #295 | Tragic 16.9% |
| Inupiat | 0.1 /100 | #296 | Tragic 16.9% |
| Israelis | 0.1 /100 | #297 | Tragic 16.8% |
| Immigrants | Zaire | 0.1 /100 | #298 | Tragic 16.7% |
| Immigrants | South America | 0.1 /100 | #299 | Tragic 16.7% |
| Cypriots | 0.0 /100 | #300 | Tragic 16.6% |
| Paraguayans | 0.0 /100 | #301 | Tragic 16.6% |
| Immigrants | Greece | 0.0 /100 | #302 | Tragic 16.5% |
| Immigrants | Serbia | 0.0 /100 | #303 | Tragic 16.4% |
| Ghanaians | 0.0 /100 | #304 | Tragic 16.4% |
| Immigrants | Morocco | 0.0 /100 | #305 | Tragic 16.3% |