Okinawan vs Immigrants from Zaire 3 or more Vehicles in Household
COMPARE
Okinawan
Immigrants from Zaire
3 or more Vehicles in Household
3 or more Vehicles in Household Comparison
Okinawans
Immigrants from Zaire
17.4%
3 OR MORE VEHICLES IN HOUSEHOLD
0.4/ 100
METRIC RATING
276th/ 347
METRIC RANK
16.7%
3 OR MORE VEHICLES IN HOUSEHOLD
0.1/ 100
METRIC RATING
298th/ 347
METRIC RANK
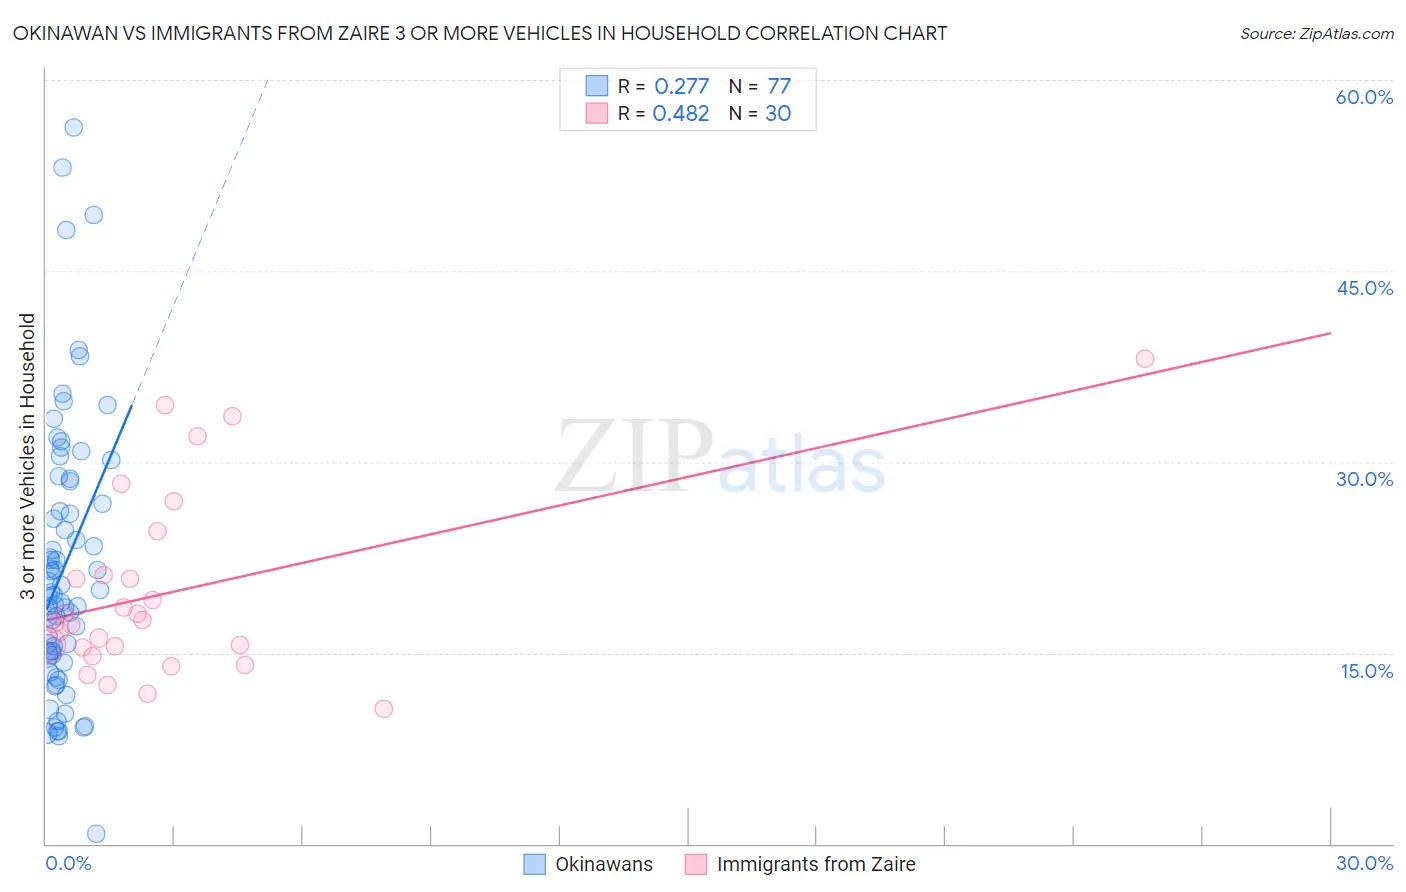
Okinawan vs Immigrants from Zaire 3 or more Vehicles in Household Correlation Chart
The statistical analysis conducted on geographies consisting of 73,703,163 people shows a weak positive correlation between the proportion of Okinawans and percentage of households with 3 or more vehicles available in the United States with a correlation coefficient (R) of 0.277 and weighted average of 17.4%. Similarly, the statistical analysis conducted on geographies consisting of 107,239,583 people shows a moderate positive correlation between the proportion of Immigrants from Zaire and percentage of households with 3 or more vehicles available in the United States with a correlation coefficient (R) of 0.482 and weighted average of 16.7%, a difference of 4.4%.
3 or more Vehicles in Household Correlation Summary
| Measurement | Okinawan | Immigrants from Zaire |
| Minimum | 0.75% | 10.6% |
| Maximum | 56.2% | 38.1% |
| Range | 55.5% | 27.5% |
| Mean | 21.7% | 19.8% |
| Median | 19.5% | 17.5% |
| Interquartile 25% (IQ1) | 14.8% | 15.4% |
| Interquartile 75% (IQ3) | 27.6% | 21.1% |
| Interquartile Range (IQR) | 12.8% | 5.7% |
| Standard Deviation (Sample) | 10.7% | 7.2% |
| Standard Deviation (Population) | 10.6% | 7.1% |
Similar Demographics by 3 or more Vehicles in Household
Demographics Similar to Okinawans by 3 or more Vehicles in Household
In terms of 3 or more vehicles in household, the demographic groups most similar to Okinawans are Brazilian (17.4%, a difference of 0.14%), Immigrants from Ukraine (17.5%, a difference of 0.16%), Immigrants from Bahamas (17.4%, a difference of 0.23%), Immigrants from Kazakhstan (17.4%, a difference of 0.25%), and Immigrants from Eastern Europe (17.4%, a difference of 0.29%).
| Demographics | Rating | Rank | 3 or more Vehicles in Household |
| Immigrants | France | 0.6 /100 | #269 | Tragic 17.6% |
| Immigrants | Nepal | 0.6 /100 | #270 | Tragic 17.6% |
| South Americans | 0.6 /100 | #271 | Tragic 17.6% |
| Immigrants | Africa | 0.5 /100 | #272 | Tragic 17.6% |
| Immigrants | Sudan | 0.5 /100 | #273 | Tragic 17.6% |
| Immigrants | Bosnia and Herzegovina | 0.5 /100 | #274 | Tragic 17.5% |
| Immigrants | Ukraine | 0.4 /100 | #275 | Tragic 17.5% |
| Okinawans | 0.4 /100 | #276 | Tragic 17.4% |
| Brazilians | 0.4 /100 | #277 | Tragic 17.4% |
| Immigrants | Bahamas | 0.3 /100 | #278 | Tragic 17.4% |
| Immigrants | Kazakhstan | 0.3 /100 | #279 | Tragic 17.4% |
| Immigrants | Eastern Europe | 0.3 /100 | #280 | Tragic 17.4% |
| Immigrants | Latvia | 0.3 /100 | #281 | Tragic 17.4% |
| Immigrants | Ireland | 0.3 /100 | #282 | Tragic 17.3% |
| Blacks/African Americans | 0.3 /100 | #283 | Tragic 17.3% |
Demographics Similar to Immigrants from Zaire by 3 or more Vehicles in Household
In terms of 3 or more vehicles in household, the demographic groups most similar to Immigrants from Zaire are Immigrants from South America (16.7%, a difference of 0.060%), Israeli (16.8%, a difference of 0.37%), Cypriot (16.6%, a difference of 0.54%), Inupiat (16.9%, a difference of 0.84%), and Paraguayan (16.6%, a difference of 0.95%).
| Demographics | Rating | Rank | 3 or more Vehicles in Household |
| Immigrants | Congo | 0.1 /100 | #291 | Tragic 17.0% |
| Immigrants | Spain | 0.1 /100 | #292 | Tragic 17.0% |
| Bahamians | 0.1 /100 | #293 | Tragic 16.9% |
| Immigrants | Western Africa | 0.1 /100 | #294 | Tragic 16.9% |
| Immigrants | Russia | 0.1 /100 | #295 | Tragic 16.9% |
| Inupiat | 0.1 /100 | #296 | Tragic 16.9% |
| Israelis | 0.1 /100 | #297 | Tragic 16.8% |
| Immigrants | Zaire | 0.1 /100 | #298 | Tragic 16.7% |
| Immigrants | South America | 0.1 /100 | #299 | Tragic 16.7% |
| Cypriots | 0.0 /100 | #300 | Tragic 16.6% |
| Paraguayans | 0.0 /100 | #301 | Tragic 16.6% |
| Immigrants | Greece | 0.0 /100 | #302 | Tragic 16.5% |
| Immigrants | Serbia | 0.0 /100 | #303 | Tragic 16.4% |
| Ghanaians | 0.0 /100 | #304 | Tragic 16.4% |
| Immigrants | Morocco | 0.0 /100 | #305 | Tragic 16.3% |