Italian vs Immigrants from Syria 3 or more Vehicles in Household
COMPARE
Italian
Immigrants from Syria
3 or more Vehicles in Household
3 or more Vehicles in Household Comparison
Italians
Immigrants from Syria
20.6%
3 OR MORE VEHICLES IN HOUSEHOLD
94.9/ 100
METRIC RATING
116th/ 347
METRIC RANK
19.4%
3 OR MORE VEHICLES IN HOUSEHOLD
40.3/ 100
METRIC RATING
178th/ 347
METRIC RANK
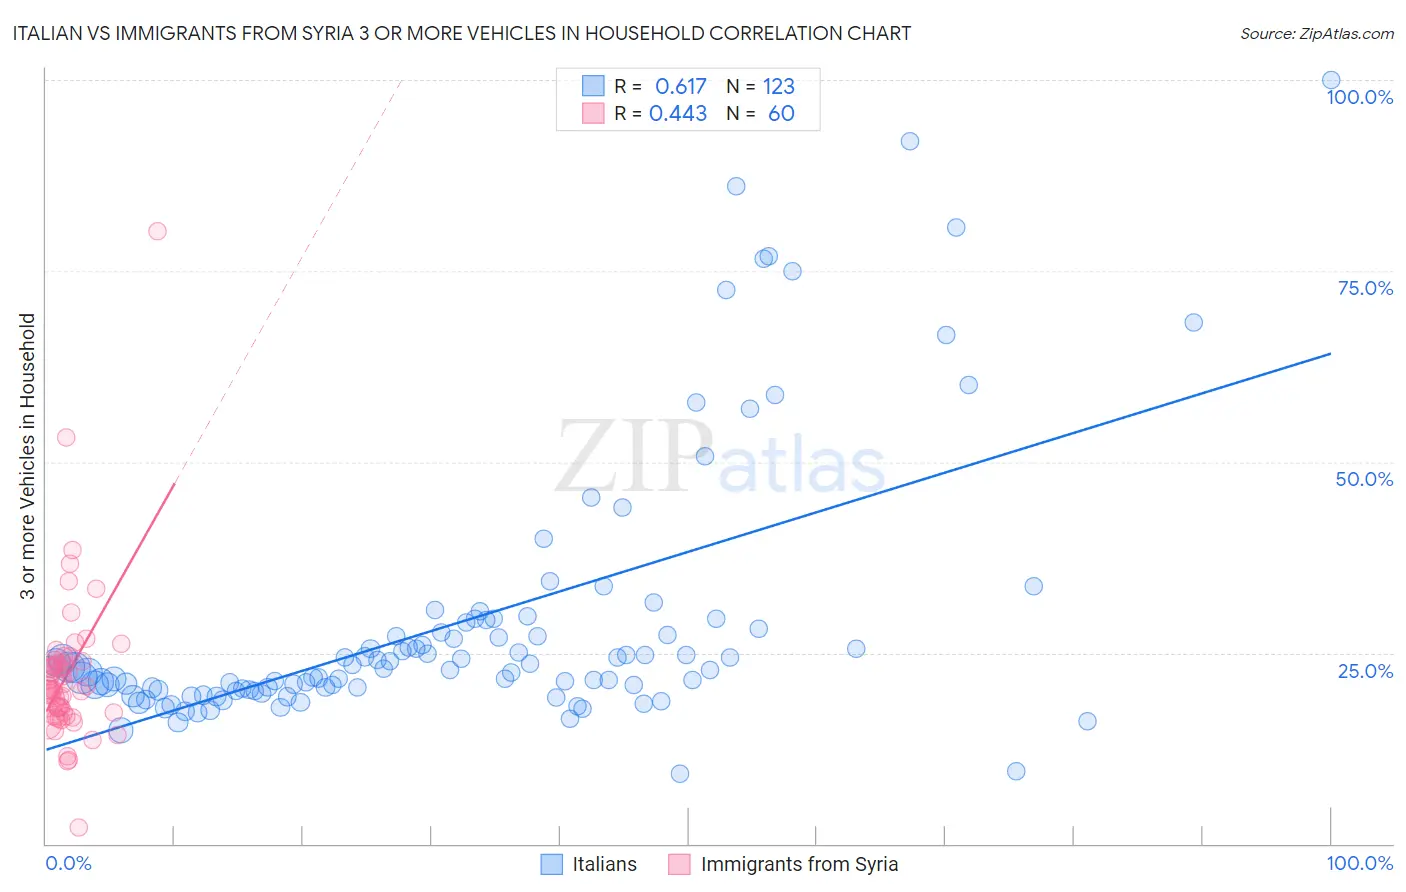
Italian vs Immigrants from Syria 3 or more Vehicles in Household Correlation Chart
The statistical analysis conducted on geographies consisting of 574,109,348 people shows a significant positive correlation between the proportion of Italians and percentage of households with 3 or more vehicles available in the United States with a correlation coefficient (R) of 0.617 and weighted average of 20.6%. Similarly, the statistical analysis conducted on geographies consisting of 174,111,368 people shows a moderate positive correlation between the proportion of Immigrants from Syria and percentage of households with 3 or more vehicles available in the United States with a correlation coefficient (R) of 0.443 and weighted average of 19.4%, a difference of 6.3%.
3 or more Vehicles in Household Correlation Summary
| Measurement | Italian | Immigrants from Syria |
| Minimum | 9.2% | 2.1% |
| Maximum | 100.0% | 80.2% |
| Range | 90.8% | 78.1% |
| Mean | 29.1% | 22.3% |
| Median | 23.0% | 20.3% |
| Interquartile 25% (IQ1) | 20.2% | 17.0% |
| Interquartile 75% (IQ3) | 28.2% | 23.7% |
| Interquartile Range (IQR) | 8.1% | 6.7% |
| Standard Deviation (Sample) | 17.5% | 10.6% |
| Standard Deviation (Population) | 17.5% | 10.5% |
Similar Demographics by 3 or more Vehicles in Household
Demographics Similar to Italians by 3 or more Vehicles in Household
In terms of 3 or more vehicles in household, the demographic groups most similar to Italians are Croatian (20.6%, a difference of 0.020%), French Canadian (20.6%, a difference of 0.030%), Costa Rican (20.6%, a difference of 0.13%), Immigrants from Latin America (20.5%, a difference of 0.17%), and Burmese (20.6%, a difference of 0.34%).
| Demographics | Rating | Rank | 3 or more Vehicles in Household |
| Filipinos | 97.0 /100 | #109 | Exceptional 20.8% |
| Asians | 96.8 /100 | #110 | Exceptional 20.8% |
| Immigrants | Micronesia | 96.7 /100 | #111 | Exceptional 20.7% |
| Nicaraguans | 96.2 /100 | #112 | Exceptional 20.7% |
| Immigrants | England | 96.2 /100 | #113 | Exceptional 20.7% |
| Burmese | 95.8 /100 | #114 | Exceptional 20.6% |
| French Canadians | 95.0 /100 | #115 | Exceptional 20.6% |
| Italians | 94.9 /100 | #116 | Exceptional 20.6% |
| Croatians | 94.9 /100 | #117 | Exceptional 20.6% |
| Costa Ricans | 94.6 /100 | #118 | Exceptional 20.6% |
| Immigrants | Latin America | 94.5 /100 | #119 | Exceptional 20.5% |
| Maltese | 93.9 /100 | #120 | Exceptional 20.5% |
| Immigrants | Thailand | 93.8 /100 | #121 | Exceptional 20.5% |
| German Russians | 93.7 /100 | #122 | Exceptional 20.5% |
| Immigrants | Korea | 93.7 /100 | #123 | Exceptional 20.5% |
Demographics Similar to Immigrants from Syria by 3 or more Vehicles in Household
In terms of 3 or more vehicles in household, the demographic groups most similar to Immigrants from Syria are Immigrants from Peru (19.4%, a difference of 0.070%), Immigrants from South Central Asia (19.3%, a difference of 0.11%), South African (19.3%, a difference of 0.22%), Romanian (19.3%, a difference of 0.25%), and Cuban (19.3%, a difference of 0.30%).
| Demographics | Rating | Rank | 3 or more Vehicles in Household |
| Immigrants | Western Europe | 53.2 /100 | #171 | Average 19.5% |
| Kiowa | 50.9 /100 | #172 | Average 19.5% |
| Immigrants | Northern Europe | 50.2 /100 | #173 | Average 19.5% |
| Immigrants | South Africa | 50.0 /100 | #174 | Average 19.5% |
| Syrians | 47.0 /100 | #175 | Average 19.5% |
| Iroquois | 46.0 /100 | #176 | Average 19.4% |
| Immigrants | Peru | 41.1 /100 | #177 | Average 19.4% |
| Immigrants | Syria | 40.3 /100 | #178 | Average 19.4% |
| Immigrants | South Central Asia | 38.9 /100 | #179 | Fair 19.3% |
| South Africans | 37.5 /100 | #180 | Fair 19.3% |
| Romanians | 37.1 /100 | #181 | Fair 19.3% |
| Cubans | 36.6 /100 | #182 | Fair 19.3% |
| Cajuns | 36.0 /100 | #183 | Fair 19.3% |
| Latvians | 35.7 /100 | #184 | Fair 19.3% |
| Immigrants | Sri Lanka | 30.7 /100 | #185 | Fair 19.2% |