Immigrants from North Macedonia vs Immigrants from Syria 3 or more Vehicles in Household
COMPARE
Immigrants from North Macedonia
Immigrants from Syria
3 or more Vehicles in Household
3 or more Vehicles in Household Comparison
Immigrants from North Macedonia
Immigrants from Syria
18.4%
3 OR MORE VEHICLES IN HOUSEHOLD
4.4/ 100
METRIC RATING
234th/ 347
METRIC RANK
19.4%
3 OR MORE VEHICLES IN HOUSEHOLD
40.3/ 100
METRIC RATING
178th/ 347
METRIC RANK
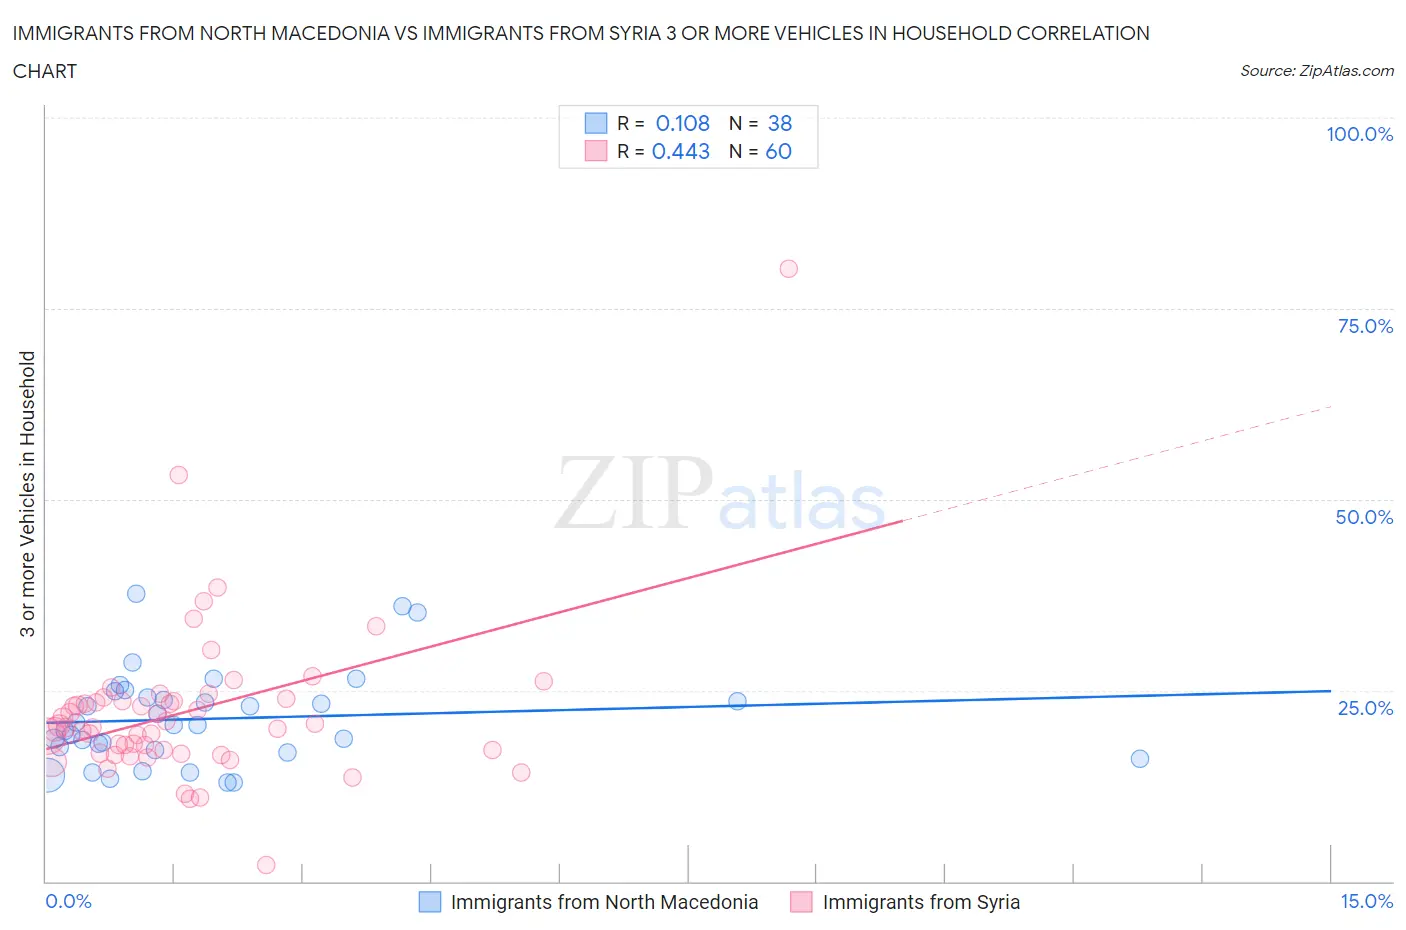
Immigrants from North Macedonia vs Immigrants from Syria 3 or more Vehicles in Household Correlation Chart
The statistical analysis conducted on geographies consisting of 74,290,299 people shows a poor positive correlation between the proportion of Immigrants from North Macedonia and percentage of households with 3 or more vehicles available in the United States with a correlation coefficient (R) of 0.108 and weighted average of 18.4%. Similarly, the statistical analysis conducted on geographies consisting of 174,111,368 people shows a moderate positive correlation between the proportion of Immigrants from Syria and percentage of households with 3 or more vehicles available in the United States with a correlation coefficient (R) of 0.443 and weighted average of 19.4%, a difference of 5.4%.
3 or more Vehicles in Household Correlation Summary
| Measurement | Immigrants from North Macedonia | Immigrants from Syria |
| Minimum | 12.9% | 2.1% |
| Maximum | 37.6% | 80.2% |
| Range | 24.7% | 78.1% |
| Mean | 21.3% | 22.3% |
| Median | 20.5% | 20.3% |
| Interquartile 25% (IQ1) | 17.2% | 17.0% |
| Interquartile 75% (IQ3) | 24.0% | 23.7% |
| Interquartile Range (IQR) | 6.8% | 6.7% |
| Standard Deviation (Sample) | 6.1% | 10.6% |
| Standard Deviation (Population) | 6.1% | 10.5% |
Similar Demographics by 3 or more Vehicles in Household
Demographics Similar to Immigrants from North Macedonia by 3 or more Vehicles in Household
In terms of 3 or more vehicles in household, the demographic groups most similar to Immigrants from North Macedonia are Honduran (18.4%, a difference of 0.070%), Immigrants from Uganda (18.4%, a difference of 0.080%), Immigrants from Belgium (18.4%, a difference of 0.15%), Immigrants from Western Asia (18.4%, a difference of 0.17%), and Immigrants from Switzerland (18.4%, a difference of 0.23%).
| Demographics | Rating | Rank | 3 or more Vehicles in Household |
| Immigrants | Singapore | 5.4 /100 | #227 | Tragic 18.4% |
| Turks | 5.4 /100 | #228 | Tragic 18.4% |
| Immigrants | Switzerland | 5.0 /100 | #229 | Tragic 18.4% |
| Immigrants | Western Asia | 4.8 /100 | #230 | Tragic 18.4% |
| Immigrants | Belgium | 4.8 /100 | #231 | Tragic 18.4% |
| Immigrants | Uganda | 4.6 /100 | #232 | Tragic 18.4% |
| Hondurans | 4.6 /100 | #233 | Tragic 18.4% |
| Immigrants | North Macedonia | 4.4 /100 | #234 | Tragic 18.4% |
| Sierra Leoneans | 3.9 /100 | #235 | Tragic 18.3% |
| Immigrants | Malaysia | 3.6 /100 | #236 | Tragic 18.3% |
| Indonesians | 3.5 /100 | #237 | Tragic 18.3% |
| Immigrants | Honduras | 3.1 /100 | #238 | Tragic 18.2% |
| Immigrants | Middle Africa | 3.1 /100 | #239 | Tragic 18.2% |
| Immigrants | China | 2.9 /100 | #240 | Tragic 18.2% |
| Africans | 2.7 /100 | #241 | Tragic 18.2% |
Demographics Similar to Immigrants from Syria by 3 or more Vehicles in Household
In terms of 3 or more vehicles in household, the demographic groups most similar to Immigrants from Syria are Immigrants from Peru (19.4%, a difference of 0.070%), Immigrants from South Central Asia (19.3%, a difference of 0.11%), South African (19.3%, a difference of 0.22%), Romanian (19.3%, a difference of 0.25%), and Cuban (19.3%, a difference of 0.30%).
| Demographics | Rating | Rank | 3 or more Vehicles in Household |
| Immigrants | Western Europe | 53.2 /100 | #171 | Average 19.5% |
| Kiowa | 50.9 /100 | #172 | Average 19.5% |
| Immigrants | Northern Europe | 50.2 /100 | #173 | Average 19.5% |
| Immigrants | South Africa | 50.0 /100 | #174 | Average 19.5% |
| Syrians | 47.0 /100 | #175 | Average 19.5% |
| Iroquois | 46.0 /100 | #176 | Average 19.4% |
| Immigrants | Peru | 41.1 /100 | #177 | Average 19.4% |
| Immigrants | Syria | 40.3 /100 | #178 | Average 19.4% |
| Immigrants | South Central Asia | 38.9 /100 | #179 | Fair 19.3% |
| South Africans | 37.5 /100 | #180 | Fair 19.3% |
| Romanians | 37.1 /100 | #181 | Fair 19.3% |
| Cubans | 36.6 /100 | #182 | Fair 19.3% |
| Cajuns | 36.0 /100 | #183 | Fair 19.3% |
| Latvians | 35.7 /100 | #184 | Fair 19.3% |
| Immigrants | Sri Lanka | 30.7 /100 | #185 | Fair 19.2% |