Aleut vs Immigrants from Malaysia 3 or more Vehicles in Household
COMPARE
Aleut
Immigrants from Malaysia
3 or more Vehicles in Household
3 or more Vehicles in Household Comparison
Aleuts
Immigrants from Malaysia
20.2%
3 OR MORE VEHICLES IN HOUSEHOLD
86.3/ 100
METRIC RATING
138th/ 347
METRIC RANK
18.3%
3 OR MORE VEHICLES IN HOUSEHOLD
3.6/ 100
METRIC RATING
236th/ 347
METRIC RANK
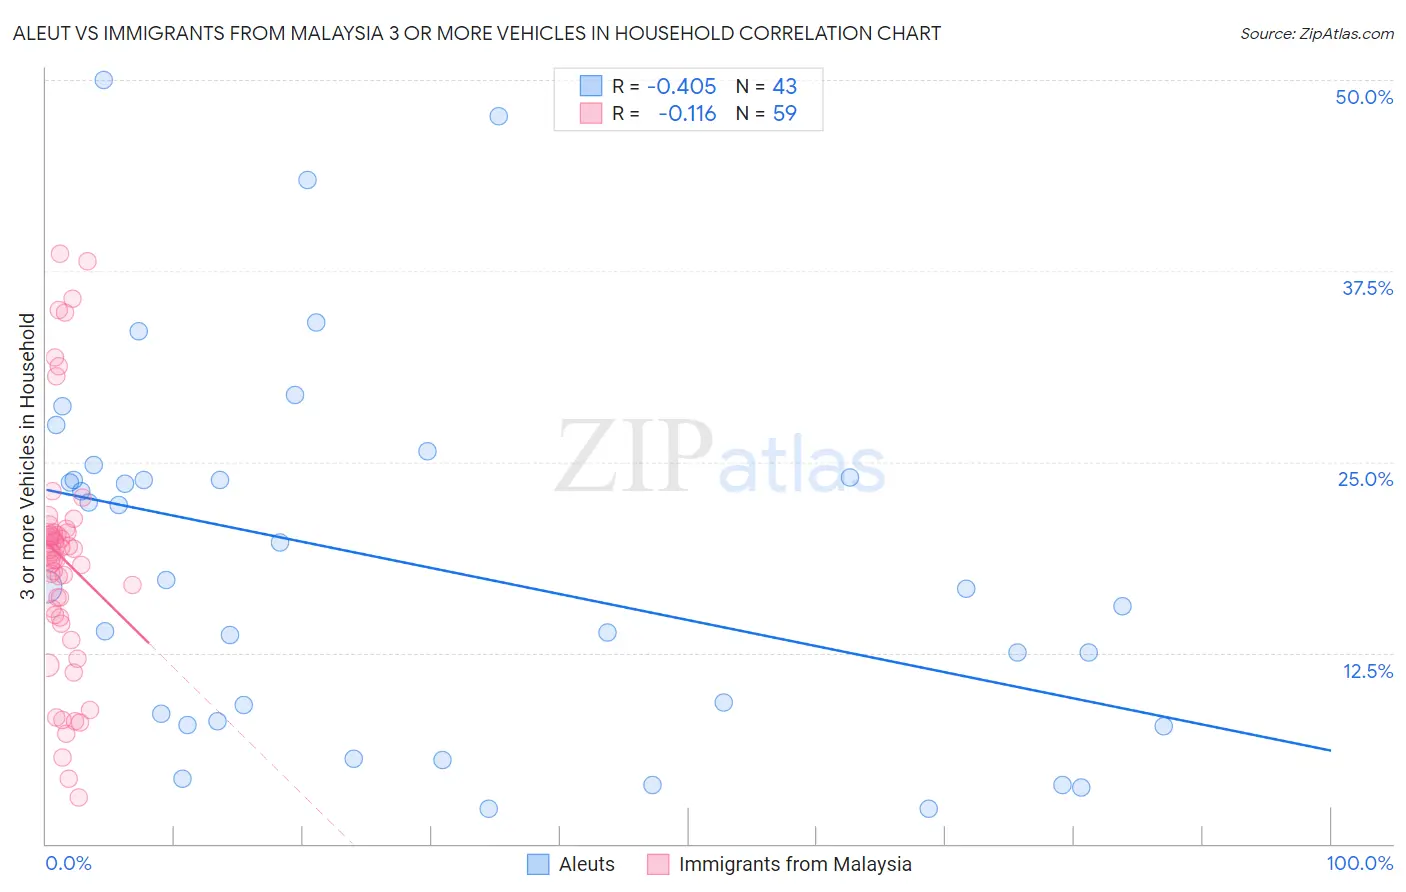
Aleut vs Immigrants from Malaysia 3 or more Vehicles in Household Correlation Chart
The statistical analysis conducted on geographies consisting of 61,759,938 people shows a moderate negative correlation between the proportion of Aleuts and percentage of households with 3 or more vehicles available in the United States with a correlation coefficient (R) of -0.405 and weighted average of 20.2%. Similarly, the statistical analysis conducted on geographies consisting of 197,846,297 people shows a poor negative correlation between the proportion of Immigrants from Malaysia and percentage of households with 3 or more vehicles available in the United States with a correlation coefficient (R) of -0.116 and weighted average of 18.3%, a difference of 10.3%.
3 or more Vehicles in Household Correlation Summary
| Measurement | Aleut | Immigrants from Malaysia |
| Minimum | 2.3% | 3.0% |
| Maximum | 50.0% | 38.6% |
| Range | 47.7% | 35.6% |
| Mean | 18.3% | 18.7% |
| Median | 16.8% | 19.1% |
| Interquartile 25% (IQ1) | 8.0% | 14.8% |
| Interquartile 75% (IQ3) | 24.0% | 20.3% |
| Interquartile Range (IQR) | 16.0% | 5.5% |
| Standard Deviation (Sample) | 12.0% | 8.0% |
| Standard Deviation (Population) | 11.8% | 7.9% |
Similar Demographics by 3 or more Vehicles in Household
Demographics Similar to Aleuts by 3 or more Vehicles in Household
In terms of 3 or more vehicles in household, the demographic groups most similar to Aleuts are Immigrants from Nicaragua (20.2%, a difference of 0.12%), Immigrants from Iraq (20.2%, a difference of 0.12%), Slovene (20.2%, a difference of 0.12%), Immigrants from India (20.2%, a difference of 0.13%), and French American Indian (20.1%, a difference of 0.15%).
| Demographics | Rating | Rank | 3 or more Vehicles in Household |
| Immigrants | Asia | 88.1 /100 | #131 | Excellent 20.2% |
| Immigrants | Canada | 87.8 /100 | #132 | Excellent 20.2% |
| Immigrants | North America | 87.8 /100 | #133 | Excellent 20.2% |
| Poles | 87.3 /100 | #134 | Excellent 20.2% |
| Immigrants | India | 87.2 /100 | #135 | Excellent 20.2% |
| Immigrants | Nicaragua | 87.1 /100 | #136 | Excellent 20.2% |
| Immigrants | Iraq | 87.1 /100 | #137 | Excellent 20.2% |
| Aleuts | 86.3 /100 | #138 | Excellent 20.2% |
| Slovenes | 85.5 /100 | #139 | Excellent 20.2% |
| French American Indians | 85.3 /100 | #140 | Excellent 20.1% |
| Ottawa | 84.9 /100 | #141 | Excellent 20.1% |
| Jordanians | 84.4 /100 | #142 | Excellent 20.1% |
| Lithuanians | 84.4 /100 | #143 | Excellent 20.1% |
| Iranians | 84.0 /100 | #144 | Excellent 20.1% |
| Palestinians | 83.9 /100 | #145 | Excellent 20.1% |
Demographics Similar to Immigrants from Malaysia by 3 or more Vehicles in Household
In terms of 3 or more vehicles in household, the demographic groups most similar to Immigrants from Malaysia are Indonesian (18.3%, a difference of 0.040%), Sierra Leonean (18.3%, a difference of 0.18%), Immigrants from Honduras (18.2%, a difference of 0.28%), Immigrants from Middle Africa (18.2%, a difference of 0.28%), and Immigrants from China (18.2%, a difference of 0.41%).
| Demographics | Rating | Rank | 3 or more Vehicles in Household |
| Immigrants | Switzerland | 5.0 /100 | #229 | Tragic 18.4% |
| Immigrants | Western Asia | 4.8 /100 | #230 | Tragic 18.4% |
| Immigrants | Belgium | 4.8 /100 | #231 | Tragic 18.4% |
| Immigrants | Uganda | 4.6 /100 | #232 | Tragic 18.4% |
| Hondurans | 4.6 /100 | #233 | Tragic 18.4% |
| Immigrants | North Macedonia | 4.4 /100 | #234 | Tragic 18.4% |
| Sierra Leoneans | 3.9 /100 | #235 | Tragic 18.3% |
| Immigrants | Malaysia | 3.6 /100 | #236 | Tragic 18.3% |
| Indonesians | 3.5 /100 | #237 | Tragic 18.3% |
| Immigrants | Honduras | 3.1 /100 | #238 | Tragic 18.2% |
| Immigrants | Middle Africa | 3.1 /100 | #239 | Tragic 18.2% |
| Immigrants | China | 2.9 /100 | #240 | Tragic 18.2% |
| Africans | 2.7 /100 | #241 | Tragic 18.2% |
| Hopi | 2.5 /100 | #242 | Tragic 18.2% |
| Immigrants | Europe | 2.4 /100 | #243 | Tragic 18.1% |