Immigrants from Pakistan vs Immigrants from Malaysia In Labor Force | Age 30-34
COMPARE
Immigrants from Pakistan
Immigrants from Malaysia
In Labor Force | Age 30-34
In Labor Force | Age 30-34 Comparison
Immigrants from Pakistan
Immigrants from Malaysia
84.9%
IN LABOR FORCE | AGE 30-34
76.2/ 100
METRIC RATING
148th/ 347
METRIC RANK
85.1%
IN LABOR FORCE | AGE 30-34
94.2/ 100
METRIC RATING
118th/ 347
METRIC RANK
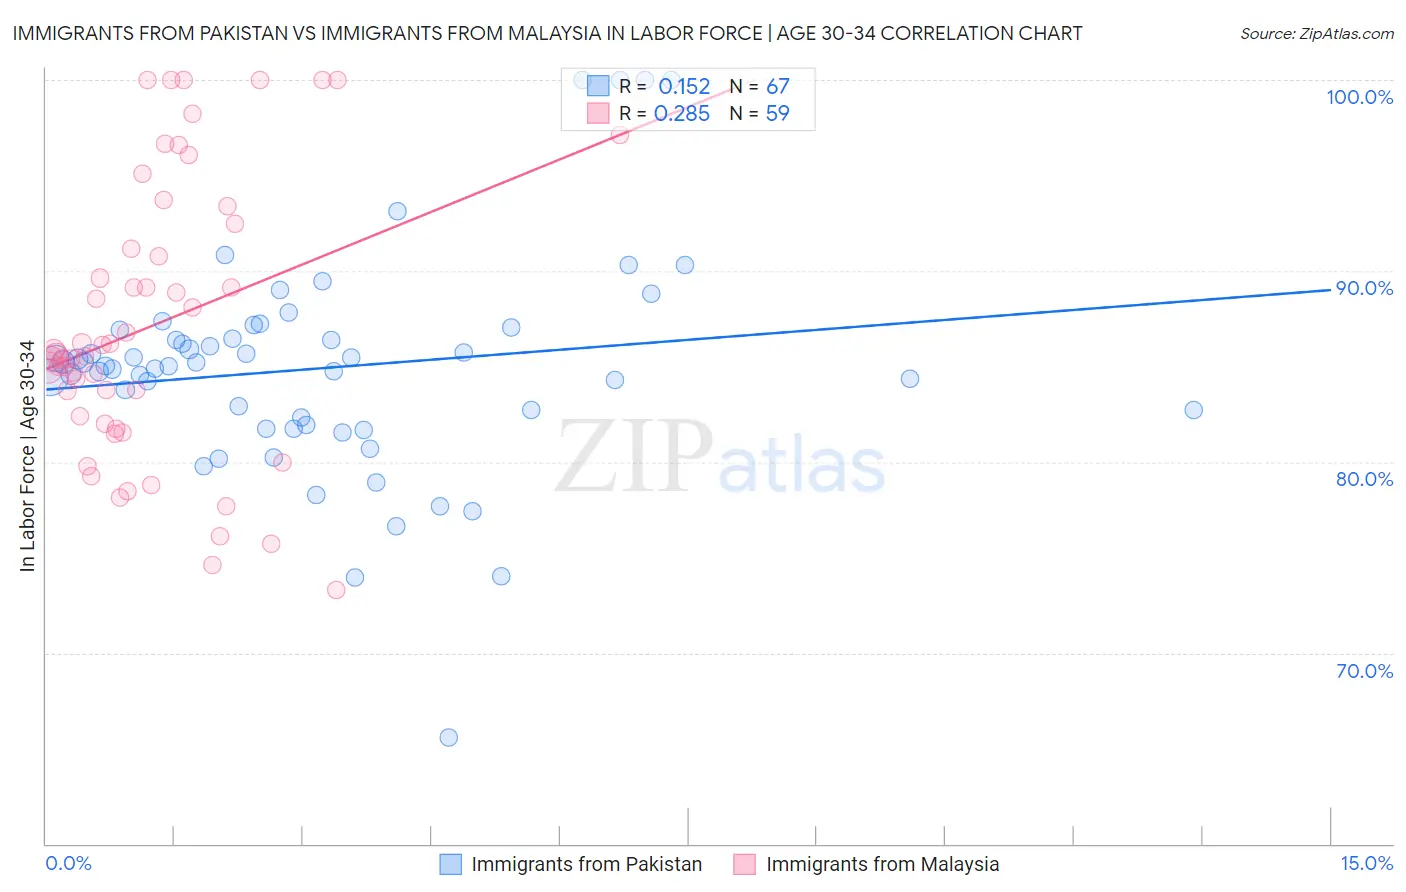
Immigrants from Pakistan vs Immigrants from Malaysia In Labor Force | Age 30-34 Correlation Chart
The statistical analysis conducted on geographies consisting of 283,823,356 people shows a poor positive correlation between the proportion of Immigrants from Pakistan and labor force participation rate among population between the ages 30 and 34 in the United States with a correlation coefficient (R) of 0.152 and weighted average of 84.9%. Similarly, the statistical analysis conducted on geographies consisting of 197,947,649 people shows a weak positive correlation between the proportion of Immigrants from Malaysia and labor force participation rate among population between the ages 30 and 34 in the United States with a correlation coefficient (R) of 0.285 and weighted average of 85.1%, a difference of 0.29%.
In Labor Force | Age 30-34 Correlation Summary
| Measurement | Immigrants from Pakistan | Immigrants from Malaysia |
| Minimum | 65.5% | 73.3% |
| Maximum | 100.0% | 100.0% |
| Range | 34.5% | 26.7% |
| Mean | 84.9% | 87.2% |
| Median | 85.0% | 85.7% |
| Interquartile 25% (IQ1) | 81.9% | 82.0% |
| Interquartile 75% (IQ3) | 86.9% | 92.5% |
| Interquartile Range (IQR) | 5.0% | 10.5% |
| Standard Deviation (Sample) | 5.8% | 7.2% |
| Standard Deviation (Population) | 5.7% | 7.1% |
Similar Demographics by In Labor Force | Age 30-34
Demographics Similar to Immigrants from Pakistan by In Labor Force | Age 30-34
In terms of in labor force | age 30-34, the demographic groups most similar to Immigrants from Pakistan are Immigrants from Saudi Arabia (84.9%, a difference of 0.0%), Immigrants from Colombia (84.9%, a difference of 0.0%), Palestinian (84.9%, a difference of 0.010%), Immigrants from Ukraine (84.8%, a difference of 0.010%), and German (84.8%, a difference of 0.010%).
| Demographics | Rating | Rank | In Labor Force | Age 30-34 |
| Chileans | 85.3 /100 | #141 | Excellent 84.9% |
| Immigrants | Indonesia | 84.3 /100 | #142 | Excellent 84.9% |
| Colombians | 82.2 /100 | #143 | Excellent 84.9% |
| Uruguayans | 78.5 /100 | #144 | Good 84.9% |
| Palestinians | 77.7 /100 | #145 | Good 84.9% |
| Immigrants | Saudi Arabia | 76.6 /100 | #146 | Good 84.9% |
| Immigrants | Colombia | 76.3 /100 | #147 | Good 84.9% |
| Immigrants | Pakistan | 76.2 /100 | #148 | Good 84.9% |
| Immigrants | Ukraine | 75.1 /100 | #149 | Good 84.8% |
| Germans | 75.1 /100 | #150 | Good 84.8% |
| Immigrants | Senegal | 74.0 /100 | #151 | Good 84.8% |
| Romanians | 73.5 /100 | #152 | Good 84.8% |
| Syrians | 70.1 /100 | #153 | Good 84.8% |
| Northern Europeans | 70.0 /100 | #154 | Good 84.8% |
| Immigrants | Sudan | 69.5 /100 | #155 | Good 84.8% |
Demographics Similar to Immigrants from Malaysia by In Labor Force | Age 30-34
In terms of in labor force | age 30-34, the demographic groups most similar to Immigrants from Malaysia are Immigrants from Denmark (85.1%, a difference of 0.0%), Immigrants from Romania (85.1%, a difference of 0.010%), Yugoslavian (85.1%, a difference of 0.010%), Immigrants from South Central Asia (85.1%, a difference of 0.010%), and Egyptian (85.1%, a difference of 0.010%).
| Demographics | Rating | Rank | In Labor Force | Age 30-34 |
| Immigrants | Scotland | 94.9 /100 | #111 | Exceptional 85.1% |
| Immigrants | Hungary | 94.8 /100 | #112 | Exceptional 85.1% |
| Immigrants | Romania | 94.7 /100 | #113 | Exceptional 85.1% |
| Yugoslavians | 94.7 /100 | #114 | Exceptional 85.1% |
| Immigrants | South Central Asia | 94.6 /100 | #115 | Exceptional 85.1% |
| Egyptians | 94.5 /100 | #116 | Exceptional 85.1% |
| Immigrants | Denmark | 94.3 /100 | #117 | Exceptional 85.1% |
| Immigrants | Malaysia | 94.2 /100 | #118 | Exceptional 85.1% |
| Asians | 93.4 /100 | #119 | Exceptional 85.1% |
| Immigrants | Southern Europe | 93.3 /100 | #120 | Exceptional 85.1% |
| Immigrants | Egypt | 93.2 /100 | #121 | Exceptional 85.1% |
| Immigrants | Kuwait | 92.6 /100 | #122 | Exceptional 85.1% |
| Armenians | 92.2 /100 | #123 | Exceptional 85.0% |
| Australians | 92.0 /100 | #124 | Exceptional 85.0% |
| Immigrants | Jordan | 91.5 /100 | #125 | Exceptional 85.0% |