Nicaraguan vs Yugoslavian 2 or more Vehicles in Household
COMPARE
Nicaraguan
Yugoslavian
2 or more Vehicles in Household
2 or more Vehicles in Household Comparison
Nicaraguans
Yugoslavians
56.1%
2 OR MORE VEHICLES IN HOUSEHOLD
79.9/ 100
METRIC RATING
150th/ 347
METRIC RANK
56.6%
2 OR MORE VEHICLES IN HOUSEHOLD
90.0/ 100
METRIC RATING
130th/ 347
METRIC RANK
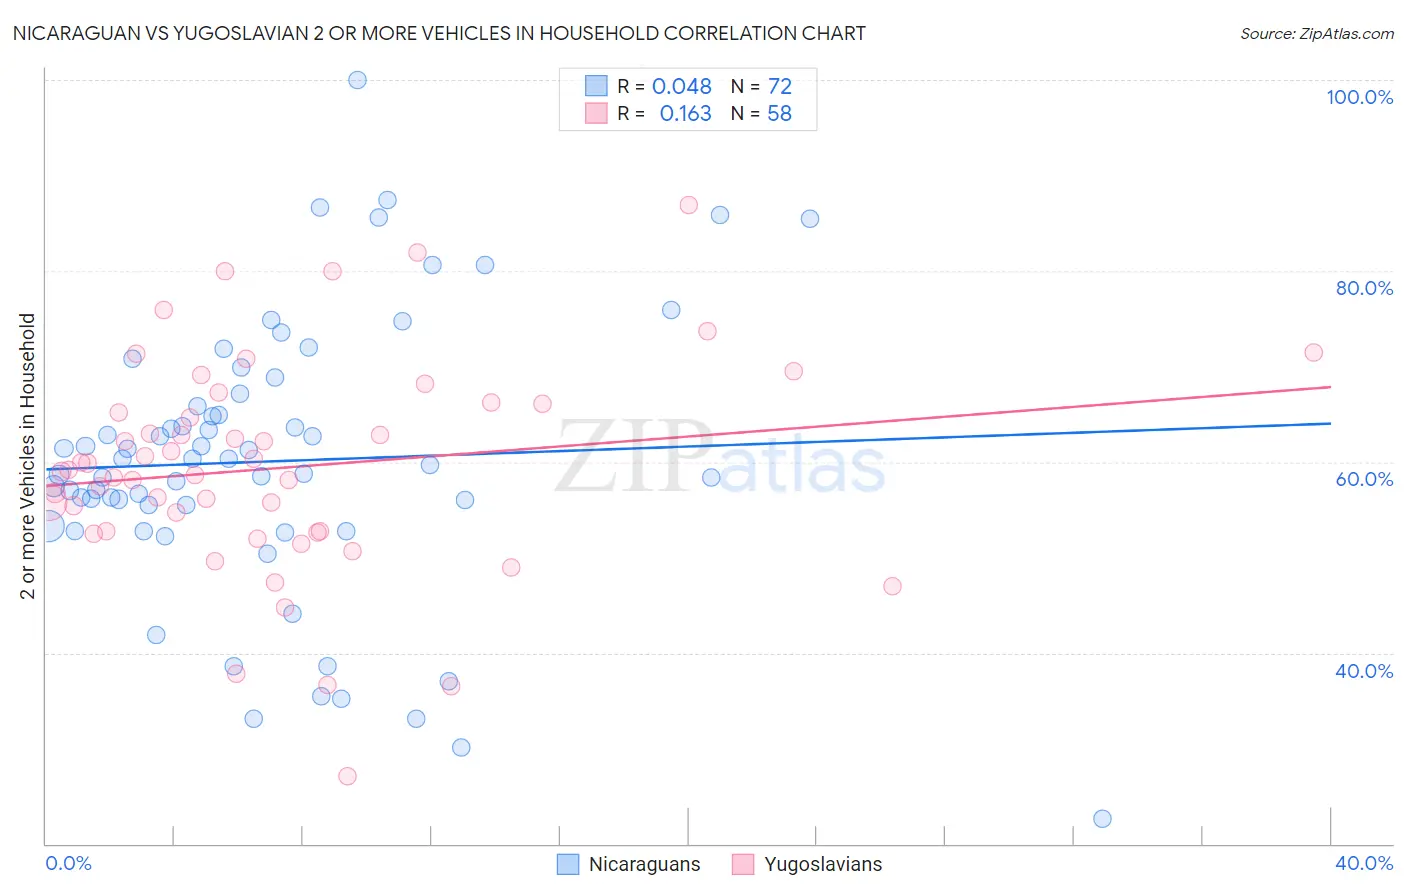
Nicaraguan vs Yugoslavian 2 or more Vehicles in Household Correlation Chart
The statistical analysis conducted on geographies consisting of 285,625,326 people shows no correlation between the proportion of Nicaraguans and percentage of households with 2 or more vehicles available in the United States with a correlation coefficient (R) of 0.048 and weighted average of 56.1%. Similarly, the statistical analysis conducted on geographies consisting of 285,645,335 people shows a poor positive correlation between the proportion of Yugoslavians and percentage of households with 2 or more vehicles available in the United States with a correlation coefficient (R) of 0.163 and weighted average of 56.6%, a difference of 0.80%.
2 or more Vehicles in Household Correlation Summary
| Measurement | Nicaraguan | Yugoslavian |
| Minimum | 22.6% | 27.0% |
| Maximum | 100.0% | 87.0% |
| Range | 77.4% | 59.9% |
| Mean | 60.1% | 59.4% |
| Median | 60.0% | 59.1% |
| Interquartile 25% (IQ1) | 54.4% | 52.7% |
| Interquartile 75% (IQ3) | 66.5% | 66.0% |
| Interquartile Range (IQR) | 12.1% | 13.3% |
| Standard Deviation (Sample) | 14.6% | 11.3% |
| Standard Deviation (Population) | 14.5% | 11.2% |
Demographics Similar to Nicaraguans and Yugoslavians by 2 or more Vehicles in Household
In terms of 2 or more vehicles in household, the demographic groups most similar to Nicaraguans are Immigrants from Moldova (56.1%, a difference of 0.020%), Chilean (56.1%, a difference of 0.020%), Serbian (56.1%, a difference of 0.030%), Venezuelan (56.1%, a difference of 0.050%), and Syrian (56.2%, a difference of 0.080%). Similarly, the demographic groups most similar to Yugoslavians are Bulgarian (56.5%, a difference of 0.030%), Hungarian (56.5%, a difference of 0.090%), Comanche (56.5%, a difference of 0.17%), Immigrants from the Azores (56.4%, a difference of 0.32%), and Blackfeet (56.4%, a difference of 0.33%).
| Demographics | Rating | Rank | 2 or more Vehicles in Household |
| Yugoslavians | 90.0 /100 | #130 | Exceptional 56.6% |
| Bulgarians | 89.7 /100 | #131 | Excellent 56.5% |
| Hungarians | 89.1 /100 | #132 | Excellent 56.5% |
| Comanche | 88.4 /100 | #133 | Excellent 56.5% |
| Immigrants | Azores | 86.6 /100 | #134 | Excellent 56.4% |
| Blackfeet | 86.5 /100 | #135 | Excellent 56.4% |
| Immigrants | Asia | 86.0 /100 | #136 | Excellent 56.3% |
| Cubans | 84.8 /100 | #137 | Excellent 56.3% |
| Salvadorans | 84.7 /100 | #138 | Excellent 56.3% |
| Armenians | 84.3 /100 | #139 | Excellent 56.3% |
| Latvians | 83.6 /100 | #140 | Excellent 56.2% |
| Immigrants | Cambodia | 83.6 /100 | #141 | Excellent 56.2% |
| South Africans | 83.1 /100 | #142 | Excellent 56.2% |
| Seminole | 81.7 /100 | #143 | Excellent 56.2% |
| Immigrants | Syria | 81.4 /100 | #144 | Excellent 56.2% |
| Syrians | 81.2 /100 | #145 | Excellent 56.2% |
| Venezuelans | 80.7 /100 | #146 | Excellent 56.1% |
| Serbians | 80.3 /100 | #147 | Excellent 56.1% |
| Immigrants | Moldova | 80.2 /100 | #148 | Excellent 56.1% |
| Chileans | 80.2 /100 | #149 | Excellent 56.1% |
| Nicaraguans | 79.9 /100 | #150 | Good 56.1% |