Immigrants from Philippines vs Yugoslavian 2 or more Vehicles in Household
COMPARE
Immigrants from Philippines
Yugoslavian
2 or more Vehicles in Household
2 or more Vehicles in Household Comparison
Immigrants from Philippines
Yugoslavians
60.1%
2 OR MORE VEHICLES IN HOUSEHOLD
100.0/ 100
METRIC RATING
35th/ 347
METRIC RANK
56.6%
2 OR MORE VEHICLES IN HOUSEHOLD
90.0/ 100
METRIC RATING
130th/ 347
METRIC RANK
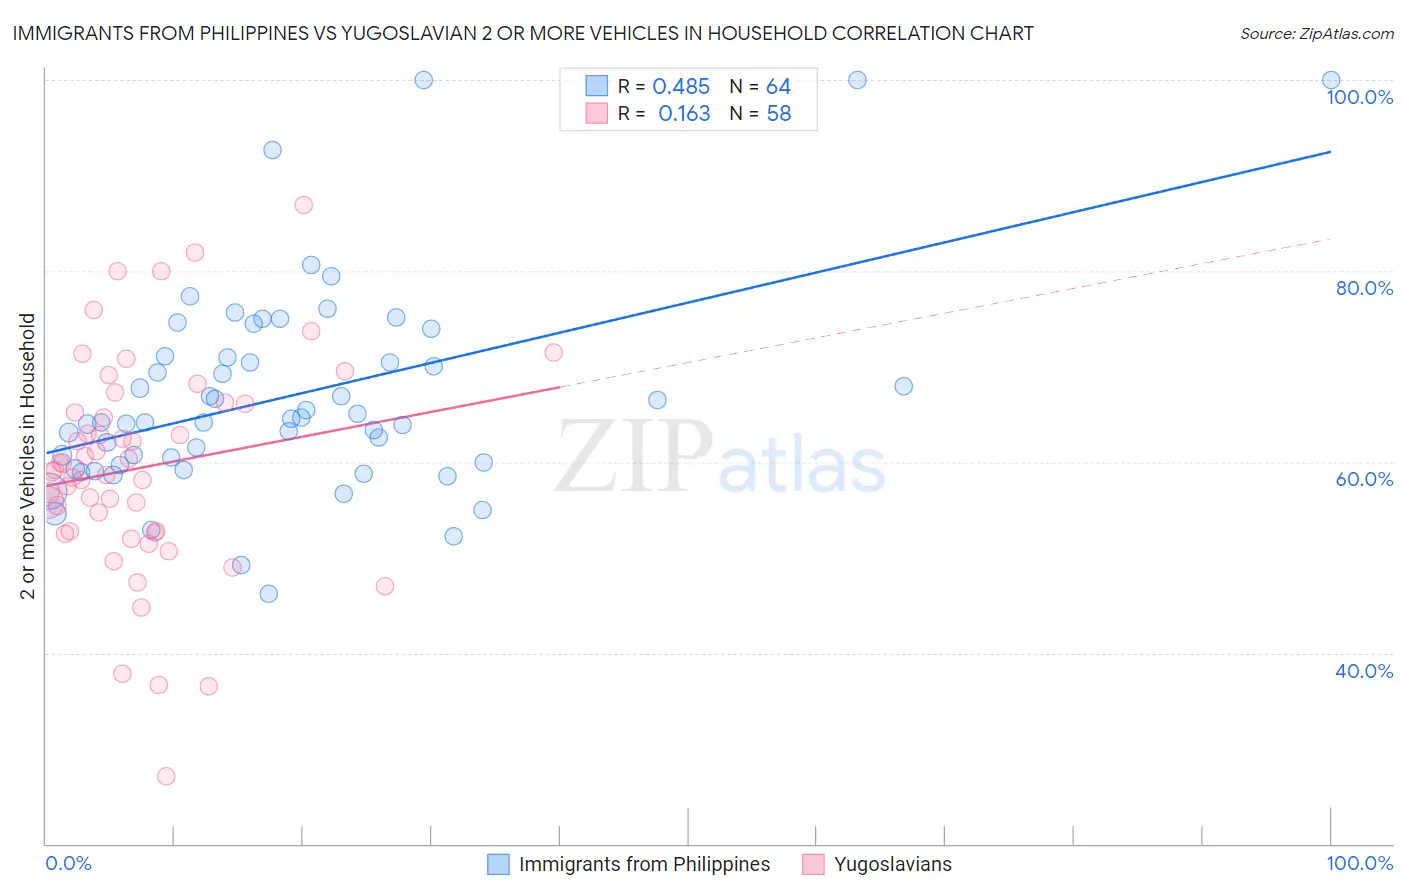
Immigrants from Philippines vs Yugoslavian 2 or more Vehicles in Household Correlation Chart
The statistical analysis conducted on geographies consisting of 471,056,019 people shows a moderate positive correlation between the proportion of Immigrants from Philippines and percentage of households with 2 or more vehicles available in the United States with a correlation coefficient (R) of 0.485 and weighted average of 60.1%. Similarly, the statistical analysis conducted on geographies consisting of 285,645,335 people shows a poor positive correlation between the proportion of Yugoslavians and percentage of households with 2 or more vehicles available in the United States with a correlation coefficient (R) of 0.163 and weighted average of 56.6%, a difference of 6.3%.
2 or more Vehicles in Household Correlation Summary
| Measurement | Immigrants from Philippines | Yugoslavian |
| Minimum | 46.2% | 27.0% |
| Maximum | 100.0% | 87.0% |
| Range | 53.8% | 59.9% |
| Mean | 66.9% | 59.4% |
| Median | 64.3% | 59.1% |
| Interquartile 25% (IQ1) | 59.8% | 52.7% |
| Interquartile 75% (IQ3) | 71.0% | 66.0% |
| Interquartile Range (IQR) | 11.2% | 13.3% |
| Standard Deviation (Sample) | 10.9% | 11.3% |
| Standard Deviation (Population) | 10.8% | 11.2% |
Similar Demographics by 2 or more Vehicles in Household
Demographics Similar to Immigrants from Philippines by 2 or more Vehicles in Household
In terms of 2 or more vehicles in household, the demographic groups most similar to Immigrants from Philippines are Chinese (60.1%, a difference of 0.020%), Irish (60.1%, a difference of 0.060%), Spanish (60.2%, a difference of 0.12%), American (60.0%, a difference of 0.12%), and British (60.0%, a difference of 0.12%).
| Demographics | Rating | Rank | 2 or more Vehicles in Household |
| Guamanians/Chamorros | 100.0 /100 | #28 | Exceptional 60.5% |
| Hawaiians | 100.0 /100 | #29 | Exceptional 60.4% |
| Finns | 100.0 /100 | #30 | Exceptional 60.3% |
| Spanish American Indians | 100.0 /100 | #31 | Exceptional 60.3% |
| Arapaho | 100.0 /100 | #32 | Exceptional 60.2% |
| Immigrants | Mexico | 100.0 /100 | #33 | Exceptional 60.2% |
| Spanish | 100.0 /100 | #34 | Exceptional 60.2% |
| Immigrants | Philippines | 100.0 /100 | #35 | Exceptional 60.1% |
| Chinese | 100.0 /100 | #36 | Exceptional 60.1% |
| Irish | 100.0 /100 | #37 | Exceptional 60.1% |
| Americans | 100.0 /100 | #38 | Exceptional 60.0% |
| British | 100.0 /100 | #39 | Exceptional 60.0% |
| Cherokee | 100.0 /100 | #40 | Exceptional 59.9% |
| Northern Europeans | 100.0 /100 | #41 | Exceptional 59.9% |
| Malaysians | 100.0 /100 | #42 | Exceptional 59.8% |
Demographics Similar to Yugoslavians by 2 or more Vehicles in Household
In terms of 2 or more vehicles in household, the demographic groups most similar to Yugoslavians are Bulgarian (56.5%, a difference of 0.030%), Ute (56.6%, a difference of 0.040%), Immigrants from South Central Asia (56.6%, a difference of 0.060%), Immigrants from Thailand (56.6%, a difference of 0.070%), and Hungarian (56.5%, a difference of 0.090%).
| Demographics | Rating | Rank | 2 or more Vehicles in Household |
| Australians | 91.8 /100 | #123 | Exceptional 56.7% |
| New Zealanders | 91.8 /100 | #124 | Exceptional 56.7% |
| Tsimshian | 91.6 /100 | #125 | Exceptional 56.7% |
| Estonians | 90.9 /100 | #126 | Exceptional 56.6% |
| Immigrants | Thailand | 90.7 /100 | #127 | Exceptional 56.6% |
| Immigrants | South Central Asia | 90.5 /100 | #128 | Exceptional 56.6% |
| Ute | 90.4 /100 | #129 | Exceptional 56.6% |
| Yugoslavians | 90.0 /100 | #130 | Exceptional 56.6% |
| Bulgarians | 89.7 /100 | #131 | Excellent 56.5% |
| Hungarians | 89.1 /100 | #132 | Excellent 56.5% |
| Comanche | 88.4 /100 | #133 | Excellent 56.5% |
| Immigrants | Azores | 86.6 /100 | #134 | Excellent 56.4% |
| Blackfeet | 86.5 /100 | #135 | Excellent 56.4% |
| Immigrants | Asia | 86.0 /100 | #136 | Excellent 56.3% |
| Cubans | 84.8 /100 | #137 | Excellent 56.3% |