Immigrants from China vs Immigrants from Zaire 2 or more Vehicles in Household
COMPARE
Immigrants from China
Immigrants from Zaire
2 or more Vehicles in Household
2 or more Vehicles in Household Comparison
Immigrants from China
Immigrants from Zaire
51.5%
2 OR MORE VEHICLES IN HOUSEHOLD
0.1/ 100
METRIC RATING
283rd/ 347
METRIC RANK
51.5%
2 OR MORE VEHICLES IN HOUSEHOLD
0.1/ 100
METRIC RATING
284th/ 347
METRIC RANK
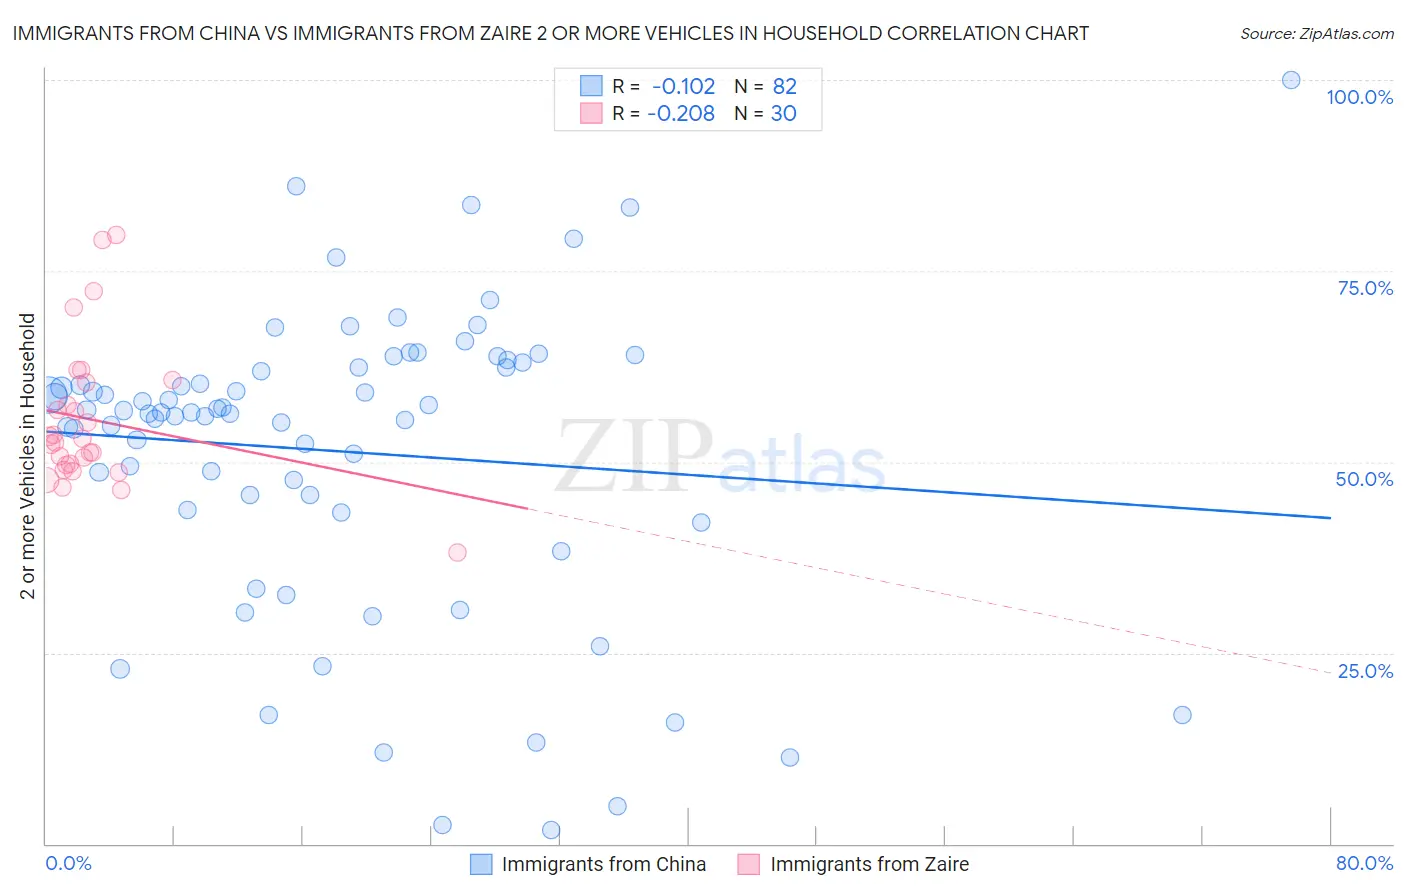
Immigrants from China vs Immigrants from Zaire 2 or more Vehicles in Household Correlation Chart
The statistical analysis conducted on geographies consisting of 456,653,967 people shows a poor negative correlation between the proportion of Immigrants from China and percentage of households with 2 or more vehicles available in the United States with a correlation coefficient (R) of -0.102 and weighted average of 51.5%. Similarly, the statistical analysis conducted on geographies consisting of 107,246,082 people shows a weak negative correlation between the proportion of Immigrants from Zaire and percentage of households with 2 or more vehicles available in the United States with a correlation coefficient (R) of -0.208 and weighted average of 51.5%, a difference of 0.040%.
2 or more Vehicles in Household Correlation Summary
| Measurement | Immigrants from China | Immigrants from Zaire |
| Minimum | 1.8% | 38.1% |
| Maximum | 100.0% | 79.7% |
| Range | 98.2% | 41.6% |
| Mean | 51.4% | 55.5% |
| Median | 56.4% | 52.7% |
| Interquartile 25% (IQ1) | 43.8% | 49.5% |
| Interquartile 75% (IQ3) | 62.3% | 60.4% |
| Interquartile Range (IQR) | 18.6% | 10.8% |
| Standard Deviation (Sample) | 19.7% | 9.5% |
| Standard Deviation (Population) | 19.6% | 9.4% |
Demographics Similar to Immigrants from China and Immigrants from Zaire by 2 or more Vehicles in Household
In terms of 2 or more vehicles in household, the demographic groups most similar to Immigrants from China are Bahamian (51.5%, a difference of 0.080%), Immigrants from Kazakhstan (51.6%, a difference of 0.14%), Immigrants from Uruguay (51.4%, a difference of 0.20%), Immigrants from Liberia (51.3%, a difference of 0.34%), and Immigrants from Serbia (51.3%, a difference of 0.37%). Similarly, the demographic groups most similar to Immigrants from Zaire are Bahamian (51.5%, a difference of 0.12%), Immigrants from Uruguay (51.4%, a difference of 0.16%), Immigrants from Kazakhstan (51.6%, a difference of 0.18%), Immigrants from Liberia (51.3%, a difference of 0.30%), and Immigrants from Serbia (51.3%, a difference of 0.33%).
| Demographics | Rating | Rank | 2 or more Vehicles in Household |
| Israelis | 0.2 /100 | #273 | Tragic 51.9% |
| Africans | 0.2 /100 | #274 | Tragic 51.8% |
| Immigrants | Honduras | 0.2 /100 | #275 | Tragic 51.8% |
| Immigrants | Croatia | 0.2 /100 | #276 | Tragic 51.8% |
| Immigrants | Africa | 0.2 /100 | #277 | Tragic 51.8% |
| Yuman | 0.1 /100 | #278 | Tragic 51.7% |
| Liberians | 0.1 /100 | #279 | Tragic 51.7% |
| Immigrants | Eastern Europe | 0.1 /100 | #280 | Tragic 51.7% |
| Immigrants | Kazakhstan | 0.1 /100 | #281 | Tragic 51.6% |
| Bahamians | 0.1 /100 | #282 | Tragic 51.5% |
| Immigrants | China | 0.1 /100 | #283 | Tragic 51.5% |
| Immigrants | Zaire | 0.1 /100 | #284 | Tragic 51.5% |
| Immigrants | Uruguay | 0.1 /100 | #285 | Tragic 51.4% |
| Immigrants | Liberia | 0.1 /100 | #286 | Tragic 51.3% |
| Immigrants | Serbia | 0.1 /100 | #287 | Tragic 51.3% |
| Okinawans | 0.1 /100 | #288 | Tragic 51.2% |
| Somalis | 0.0 /100 | #289 | Tragic 51.1% |
| Immigrants | Panama | 0.0 /100 | #290 | Tragic 51.1% |
| Belizeans | 0.0 /100 | #291 | Tragic 51.0% |
| Immigrants | Ukraine | 0.0 /100 | #292 | Tragic 50.9% |
| Blacks/African Americans | 0.0 /100 | #293 | Tragic 50.9% |