Samoan vs Immigrants from Zaire 2 or more Vehicles in Household
COMPARE
Samoan
Immigrants from Zaire
2 or more Vehicles in Household
2 or more Vehicles in Household Comparison
Samoans
Immigrants from Zaire
61.5%
2 OR MORE VEHICLES IN HOUSEHOLD
100.0/ 100
METRIC RATING
13th/ 347
METRIC RANK
51.5%
2 OR MORE VEHICLES IN HOUSEHOLD
0.1/ 100
METRIC RATING
284th/ 347
METRIC RANK
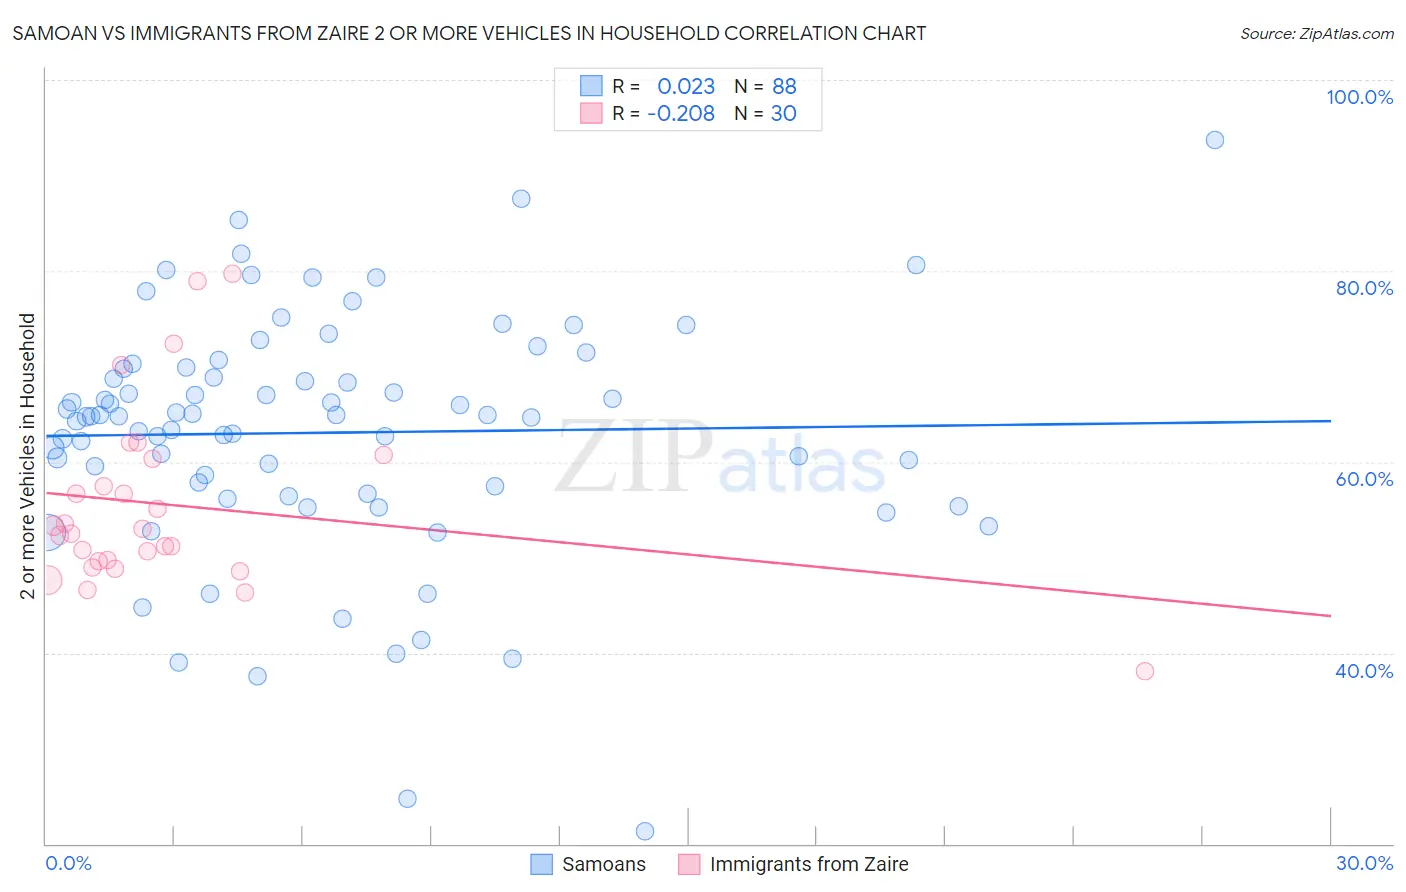
Samoan vs Immigrants from Zaire 2 or more Vehicles in Household Correlation Chart
The statistical analysis conducted on geographies consisting of 225,081,669 people shows no correlation between the proportion of Samoans and percentage of households with 2 or more vehicles available in the United States with a correlation coefficient (R) of 0.023 and weighted average of 61.5%. Similarly, the statistical analysis conducted on geographies consisting of 107,246,082 people shows a weak negative correlation between the proportion of Immigrants from Zaire and percentage of households with 2 or more vehicles available in the United States with a correlation coefficient (R) of -0.208 and weighted average of 51.5%, a difference of 19.5%.
2 or more Vehicles in Household Correlation Summary
| Measurement | Samoan | Immigrants from Zaire |
| Minimum | 21.3% | 38.1% |
| Maximum | 93.8% | 79.7% |
| Range | 72.4% | 41.6% |
| Mean | 63.1% | 55.5% |
| Median | 64.8% | 52.7% |
| Interquartile 25% (IQ1) | 57.1% | 49.5% |
| Interquartile 75% (IQ3) | 69.8% | 60.4% |
| Interquartile Range (IQR) | 12.7% | 10.8% |
| Standard Deviation (Sample) | 12.6% | 9.5% |
| Standard Deviation (Population) | 12.5% | 9.4% |
Similar Demographics by 2 or more Vehicles in Household
Demographics Similar to Samoans by 2 or more Vehicles in Household
In terms of 2 or more vehicles in household, the demographic groups most similar to Samoans are Czech (61.5%, a difference of 0.050%), German (61.6%, a difference of 0.12%), Nepalese (61.4%, a difference of 0.14%), Native Hawaiian (61.4%, a difference of 0.16%), and Basque (61.4%, a difference of 0.22%).
| Demographics | Rating | Rank | 2 or more Vehicles in Household |
| Scandinavians | 100.0 /100 | #6 | Exceptional 62.1% |
| Puget Sound Salish | 100.0 /100 | #7 | Exceptional 62.1% |
| English | 100.0 /100 | #8 | Exceptional 61.9% |
| Swedes | 100.0 /100 | #9 | Exceptional 61.8% |
| Mexicans | 100.0 /100 | #10 | Exceptional 61.7% |
| Dutch | 100.0 /100 | #11 | Exceptional 61.6% |
| Germans | 100.0 /100 | #12 | Exceptional 61.6% |
| Samoans | 100.0 /100 | #13 | Exceptional 61.5% |
| Czechs | 100.0 /100 | #14 | Exceptional 61.5% |
| Nepalese | 100.0 /100 | #15 | Exceptional 61.4% |
| Native Hawaiians | 100.0 /100 | #16 | Exceptional 61.4% |
| Basques | 100.0 /100 | #17 | Exceptional 61.4% |
| Europeans | 100.0 /100 | #18 | Exceptional 61.4% |
| Scottish | 100.0 /100 | #19 | Exceptional 61.2% |
| Sri Lankans | 100.0 /100 | #20 | Exceptional 61.0% |
Demographics Similar to Immigrants from Zaire by 2 or more Vehicles in Household
In terms of 2 or more vehicles in household, the demographic groups most similar to Immigrants from Zaire are Immigrants from China (51.5%, a difference of 0.040%), Bahamian (51.5%, a difference of 0.12%), Immigrants from Uruguay (51.4%, a difference of 0.16%), Immigrants from Kazakhstan (51.6%, a difference of 0.18%), and Immigrants from Liberia (51.3%, a difference of 0.30%).
| Demographics | Rating | Rank | 2 or more Vehicles in Household |
| Immigrants | Africa | 0.2 /100 | #277 | Tragic 51.8% |
| Yuman | 0.1 /100 | #278 | Tragic 51.7% |
| Liberians | 0.1 /100 | #279 | Tragic 51.7% |
| Immigrants | Eastern Europe | 0.1 /100 | #280 | Tragic 51.7% |
| Immigrants | Kazakhstan | 0.1 /100 | #281 | Tragic 51.6% |
| Bahamians | 0.1 /100 | #282 | Tragic 51.5% |
| Immigrants | China | 0.1 /100 | #283 | Tragic 51.5% |
| Immigrants | Zaire | 0.1 /100 | #284 | Tragic 51.5% |
| Immigrants | Uruguay | 0.1 /100 | #285 | Tragic 51.4% |
| Immigrants | Liberia | 0.1 /100 | #286 | Tragic 51.3% |
| Immigrants | Serbia | 0.1 /100 | #287 | Tragic 51.3% |
| Okinawans | 0.1 /100 | #288 | Tragic 51.2% |
| Somalis | 0.0 /100 | #289 | Tragic 51.1% |
| Immigrants | Panama | 0.0 /100 | #290 | Tragic 51.1% |
| Belizeans | 0.0 /100 | #291 | Tragic 51.0% |