German Russian vs Immigrants from Zaire 2 or more Vehicles in Household
COMPARE
German Russian
Immigrants from Zaire
2 or more Vehicles in Household
2 or more Vehicles in Household Comparison
German Russians
Immigrants from Zaire
55.6%
2 OR MORE VEHICLES IN HOUSEHOLD
60.9/ 100
METRIC RATING
162nd/ 347
METRIC RANK
51.5%
2 OR MORE VEHICLES IN HOUSEHOLD
0.1/ 100
METRIC RATING
284th/ 347
METRIC RANK
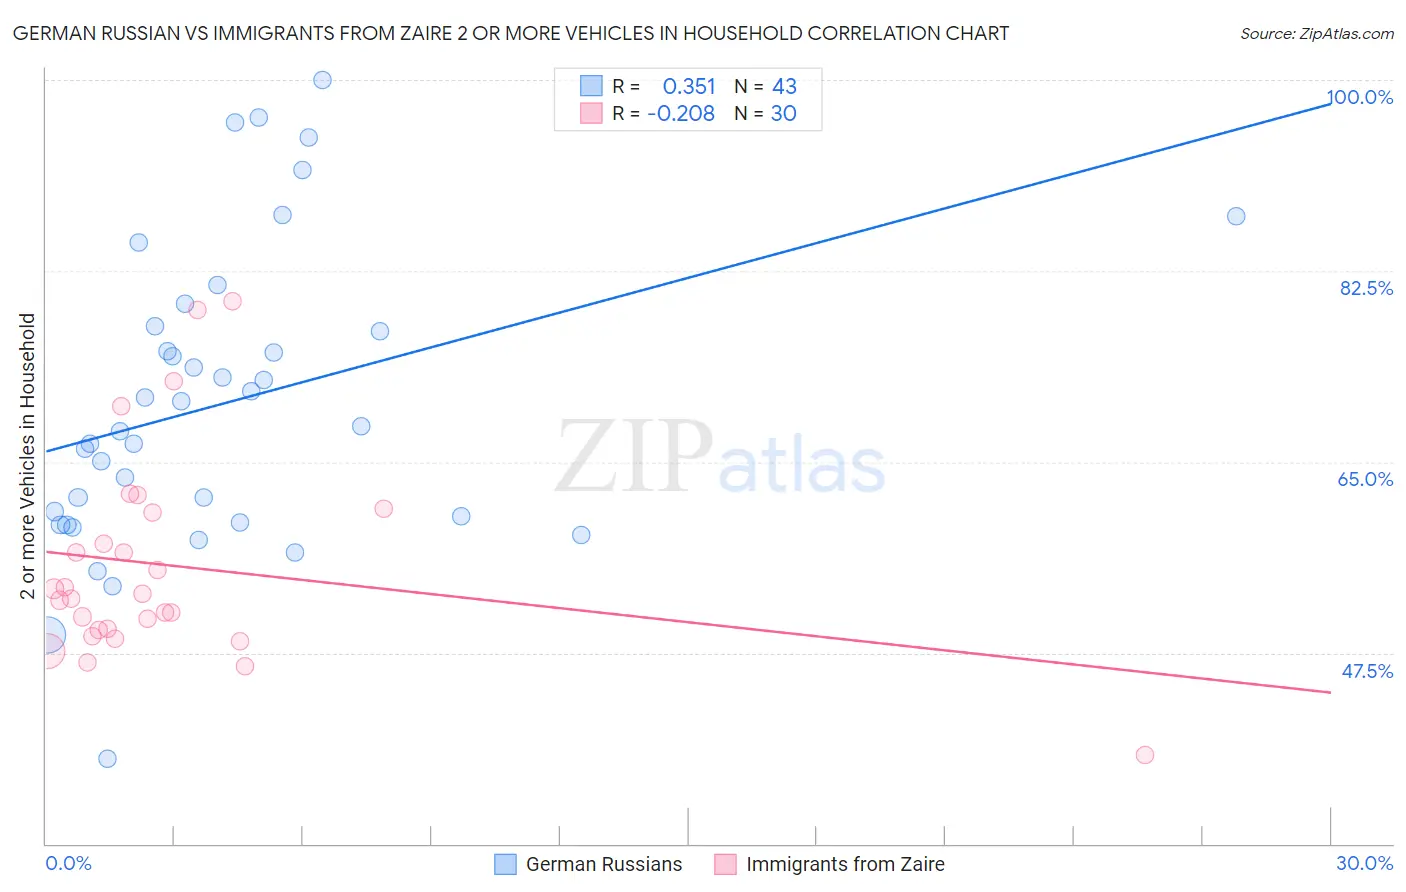
German Russian vs Immigrants from Zaire 2 or more Vehicles in Household Correlation Chart
The statistical analysis conducted on geographies consisting of 96,451,375 people shows a mild positive correlation between the proportion of German Russians and percentage of households with 2 or more vehicles available in the United States with a correlation coefficient (R) of 0.351 and weighted average of 55.6%. Similarly, the statistical analysis conducted on geographies consisting of 107,246,082 people shows a weak negative correlation between the proportion of Immigrants from Zaire and percentage of households with 2 or more vehicles available in the United States with a correlation coefficient (R) of -0.208 and weighted average of 51.5%, a difference of 8.0%.
2 or more Vehicles in Household Correlation Summary
| Measurement | German Russian | Immigrants from Zaire |
| Minimum | 37.7% | 38.1% |
| Maximum | 100.0% | 79.7% |
| Range | 62.3% | 41.6% |
| Mean | 70.3% | 55.5% |
| Median | 68.2% | 52.7% |
| Interquartile 25% (IQ1) | 59.5% | 49.5% |
| Interquartile 75% (IQ3) | 77.5% | 60.4% |
| Interquartile Range (IQR) | 18.0% | 10.8% |
| Standard Deviation (Sample) | 13.8% | 9.5% |
| Standard Deviation (Population) | 13.6% | 9.4% |
Similar Demographics by 2 or more Vehicles in Household
Demographics Similar to German Russians by 2 or more Vehicles in Household
In terms of 2 or more vehicles in household, the demographic groups most similar to German Russians are Colville (55.6%, a difference of 0.010%), Immigrants from Zimbabwe (55.6%, a difference of 0.030%), Dutch West Indian (55.6%, a difference of 0.040%), Immigrants from El Salvador (55.6%, a difference of 0.060%), and Immigrants from Sri Lanka (55.5%, a difference of 0.10%).
| Demographics | Rating | Rank | 2 or more Vehicles in Household |
| Immigrants | Venezuela | 70.7 /100 | #155 | Good 55.8% |
| Immigrants | Lithuania | 70.4 /100 | #156 | Good 55.8% |
| Immigrants | Kuwait | 70.2 /100 | #157 | Good 55.8% |
| Tlingit-Haida | 68.5 /100 | #158 | Good 55.8% |
| Paiute | 68.0 /100 | #159 | Good 55.8% |
| Crow | 67.0 /100 | #160 | Good 55.7% |
| Colville | 61.1 /100 | #161 | Good 55.6% |
| German Russians | 60.9 /100 | #162 | Good 55.6% |
| Immigrants | Zimbabwe | 60.2 /100 | #163 | Good 55.6% |
| Dutch West Indians | 59.8 /100 | #164 | Average 55.6% |
| Immigrants | El Salvador | 59.4 /100 | #165 | Average 55.6% |
| Immigrants | Sri Lanka | 58.3 /100 | #166 | Average 55.5% |
| Kenyans | 58.1 /100 | #167 | Average 55.5% |
| French American Indians | 56.7 /100 | #168 | Average 55.5% |
| Immigrants | Austria | 56.3 /100 | #169 | Average 55.5% |
Demographics Similar to Immigrants from Zaire by 2 or more Vehicles in Household
In terms of 2 or more vehicles in household, the demographic groups most similar to Immigrants from Zaire are Immigrants from China (51.5%, a difference of 0.040%), Bahamian (51.5%, a difference of 0.12%), Immigrants from Uruguay (51.4%, a difference of 0.16%), Immigrants from Kazakhstan (51.6%, a difference of 0.18%), and Immigrants from Liberia (51.3%, a difference of 0.30%).
| Demographics | Rating | Rank | 2 or more Vehicles in Household |
| Immigrants | Africa | 0.2 /100 | #277 | Tragic 51.8% |
| Yuman | 0.1 /100 | #278 | Tragic 51.7% |
| Liberians | 0.1 /100 | #279 | Tragic 51.7% |
| Immigrants | Eastern Europe | 0.1 /100 | #280 | Tragic 51.7% |
| Immigrants | Kazakhstan | 0.1 /100 | #281 | Tragic 51.6% |
| Bahamians | 0.1 /100 | #282 | Tragic 51.5% |
| Immigrants | China | 0.1 /100 | #283 | Tragic 51.5% |
| Immigrants | Zaire | 0.1 /100 | #284 | Tragic 51.5% |
| Immigrants | Uruguay | 0.1 /100 | #285 | Tragic 51.4% |
| Immigrants | Liberia | 0.1 /100 | #286 | Tragic 51.3% |
| Immigrants | Serbia | 0.1 /100 | #287 | Tragic 51.3% |
| Okinawans | 0.1 /100 | #288 | Tragic 51.2% |
| Somalis | 0.0 /100 | #289 | Tragic 51.1% |
| Immigrants | Panama | 0.0 /100 | #290 | Tragic 51.1% |
| Belizeans | 0.0 /100 | #291 | Tragic 51.0% |