Filipino vs Immigrants from Zaire 2 or more Vehicles in Household
COMPARE
Filipino
Immigrants from Zaire
2 or more Vehicles in Household
2 or more Vehicles in Household Comparison
Filipinos
Immigrants from Zaire
57.8%
2 OR MORE VEHICLES IN HOUSEHOLD
98.9/ 100
METRIC RATING
94th/ 347
METRIC RANK
51.5%
2 OR MORE VEHICLES IN HOUSEHOLD
0.1/ 100
METRIC RATING
284th/ 347
METRIC RANK
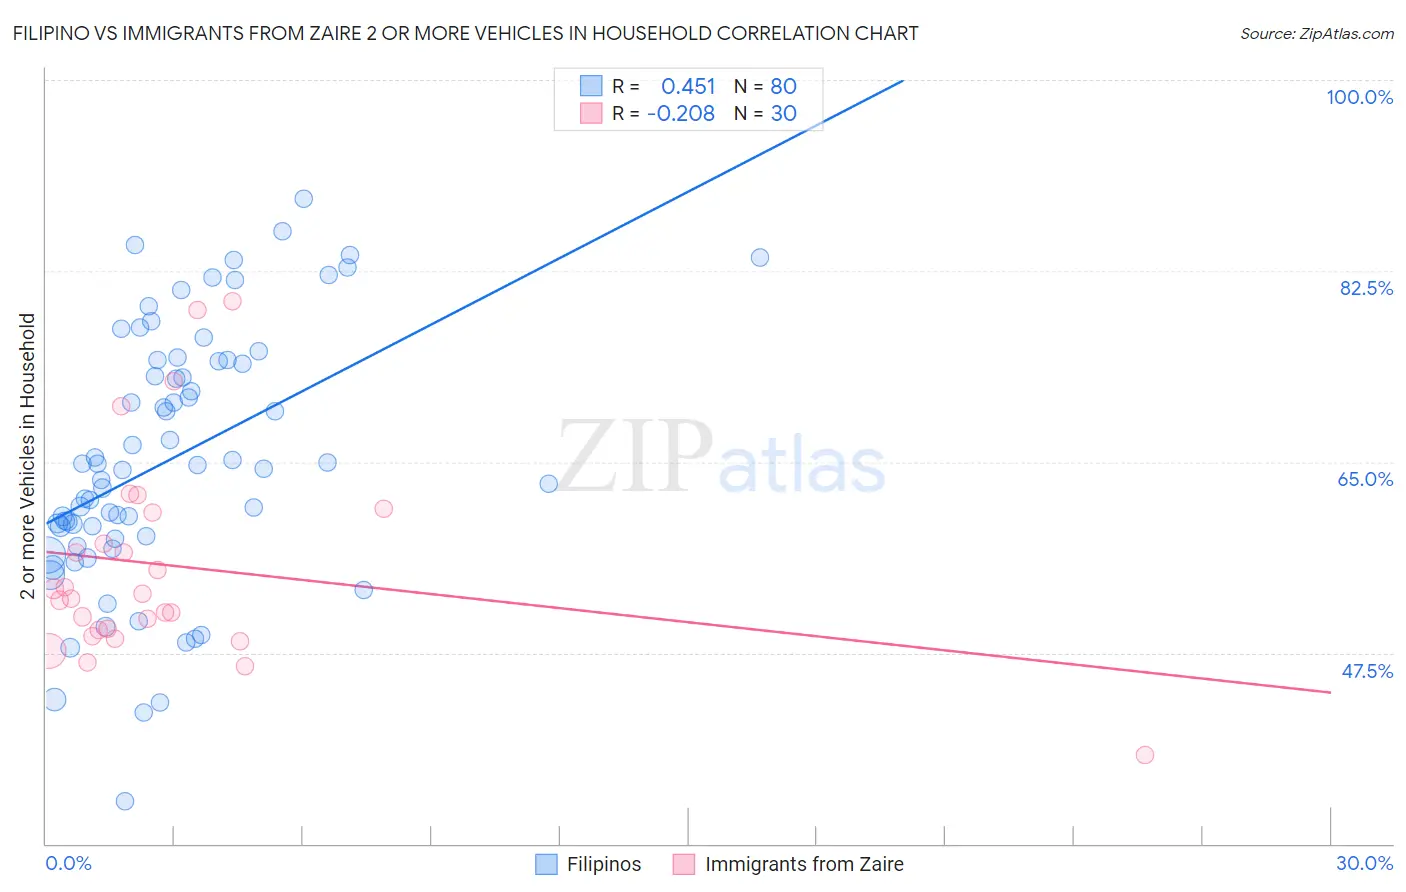
Filipino vs Immigrants from Zaire 2 or more Vehicles in Household Correlation Chart
The statistical analysis conducted on geographies consisting of 254,177,866 people shows a moderate positive correlation between the proportion of Filipinos and percentage of households with 2 or more vehicles available in the United States with a correlation coefficient (R) of 0.451 and weighted average of 57.8%. Similarly, the statistical analysis conducted on geographies consisting of 107,246,082 people shows a weak negative correlation between the proportion of Immigrants from Zaire and percentage of households with 2 or more vehicles available in the United States with a correlation coefficient (R) of -0.208 and weighted average of 51.5%, a difference of 12.3%.
2 or more Vehicles in Household Correlation Summary
| Measurement | Filipino | Immigrants from Zaire |
| Minimum | 33.9% | 38.1% |
| Maximum | 89.1% | 79.7% |
| Range | 55.2% | 41.6% |
| Mean | 65.2% | 55.5% |
| Median | 64.5% | 52.7% |
| Interquartile 25% (IQ1) | 58.1% | 49.5% |
| Interquartile 75% (IQ3) | 74.3% | 60.4% |
| Interquartile Range (IQR) | 16.2% | 10.8% |
| Standard Deviation (Sample) | 11.8% | 9.5% |
| Standard Deviation (Population) | 11.7% | 9.4% |
Similar Demographics by 2 or more Vehicles in Household
Demographics Similar to Filipinos by 2 or more Vehicles in Household
In terms of 2 or more vehicles in household, the demographic groups most similar to Filipinos are Hmong (57.8%, a difference of 0.020%), Shoshone (57.9%, a difference of 0.060%), Ottawa (57.9%, a difference of 0.060%), Burmese (57.8%, a difference of 0.060%), and Slavic (57.8%, a difference of 0.080%).
| Demographics | Rating | Rank | 2 or more Vehicles in Household |
| Thais | 99.1 /100 | #87 | Exceptional 57.9% |
| Immigrants | Iran | 99.1 /100 | #88 | Exceptional 57.9% |
| Immigrants | Germany | 99.0 /100 | #89 | Exceptional 57.9% |
| Hispanics or Latinos | 99.0 /100 | #90 | Exceptional 57.9% |
| Pakistanis | 99.0 /100 | #91 | Exceptional 57.9% |
| Shoshone | 99.0 /100 | #92 | Exceptional 57.9% |
| Ottawa | 99.0 /100 | #93 | Exceptional 57.9% |
| Filipinos | 98.9 /100 | #94 | Exceptional 57.8% |
| Hmong | 98.9 /100 | #95 | Exceptional 57.8% |
| Burmese | 98.8 /100 | #96 | Exceptional 57.8% |
| Slavs | 98.8 /100 | #97 | Exceptional 57.8% |
| Palestinians | 98.6 /100 | #98 | Exceptional 57.7% |
| Cajuns | 98.5 /100 | #99 | Exceptional 57.7% |
| Fijians | 98.4 /100 | #100 | Exceptional 57.6% |
| Lebanese | 98.3 /100 | #101 | Exceptional 57.6% |
Demographics Similar to Immigrants from Zaire by 2 or more Vehicles in Household
In terms of 2 or more vehicles in household, the demographic groups most similar to Immigrants from Zaire are Immigrants from China (51.5%, a difference of 0.040%), Bahamian (51.5%, a difference of 0.12%), Immigrants from Uruguay (51.4%, a difference of 0.16%), Immigrants from Kazakhstan (51.6%, a difference of 0.18%), and Immigrants from Liberia (51.3%, a difference of 0.30%).
| Demographics | Rating | Rank | 2 or more Vehicles in Household |
| Immigrants | Africa | 0.2 /100 | #277 | Tragic 51.8% |
| Yuman | 0.1 /100 | #278 | Tragic 51.7% |
| Liberians | 0.1 /100 | #279 | Tragic 51.7% |
| Immigrants | Eastern Europe | 0.1 /100 | #280 | Tragic 51.7% |
| Immigrants | Kazakhstan | 0.1 /100 | #281 | Tragic 51.6% |
| Bahamians | 0.1 /100 | #282 | Tragic 51.5% |
| Immigrants | China | 0.1 /100 | #283 | Tragic 51.5% |
| Immigrants | Zaire | 0.1 /100 | #284 | Tragic 51.5% |
| Immigrants | Uruguay | 0.1 /100 | #285 | Tragic 51.4% |
| Immigrants | Liberia | 0.1 /100 | #286 | Tragic 51.3% |
| Immigrants | Serbia | 0.1 /100 | #287 | Tragic 51.3% |
| Okinawans | 0.1 /100 | #288 | Tragic 51.2% |
| Somalis | 0.0 /100 | #289 | Tragic 51.1% |
| Immigrants | Panama | 0.0 /100 | #290 | Tragic 51.1% |
| Belizeans | 0.0 /100 | #291 | Tragic 51.0% |