Alaskan Athabascan vs Immigrants from Uzbekistan 2 or more Vehicles in Household
COMPARE
Alaskan Athabascan
Immigrants from Uzbekistan
2 or more Vehicles in Household
2 or more Vehicles in Household Comparison
Alaskan Athabascans
Immigrants from Uzbekistan
55.2%
2 OR MORE VEHICLES IN HOUSEHOLD
42.9/ 100
METRIC RATING
179th/ 347
METRIC RANK
37.9%
2 OR MORE VEHICLES IN HOUSEHOLD
0.0/ 100
METRIC RATING
338th/ 347
METRIC RANK
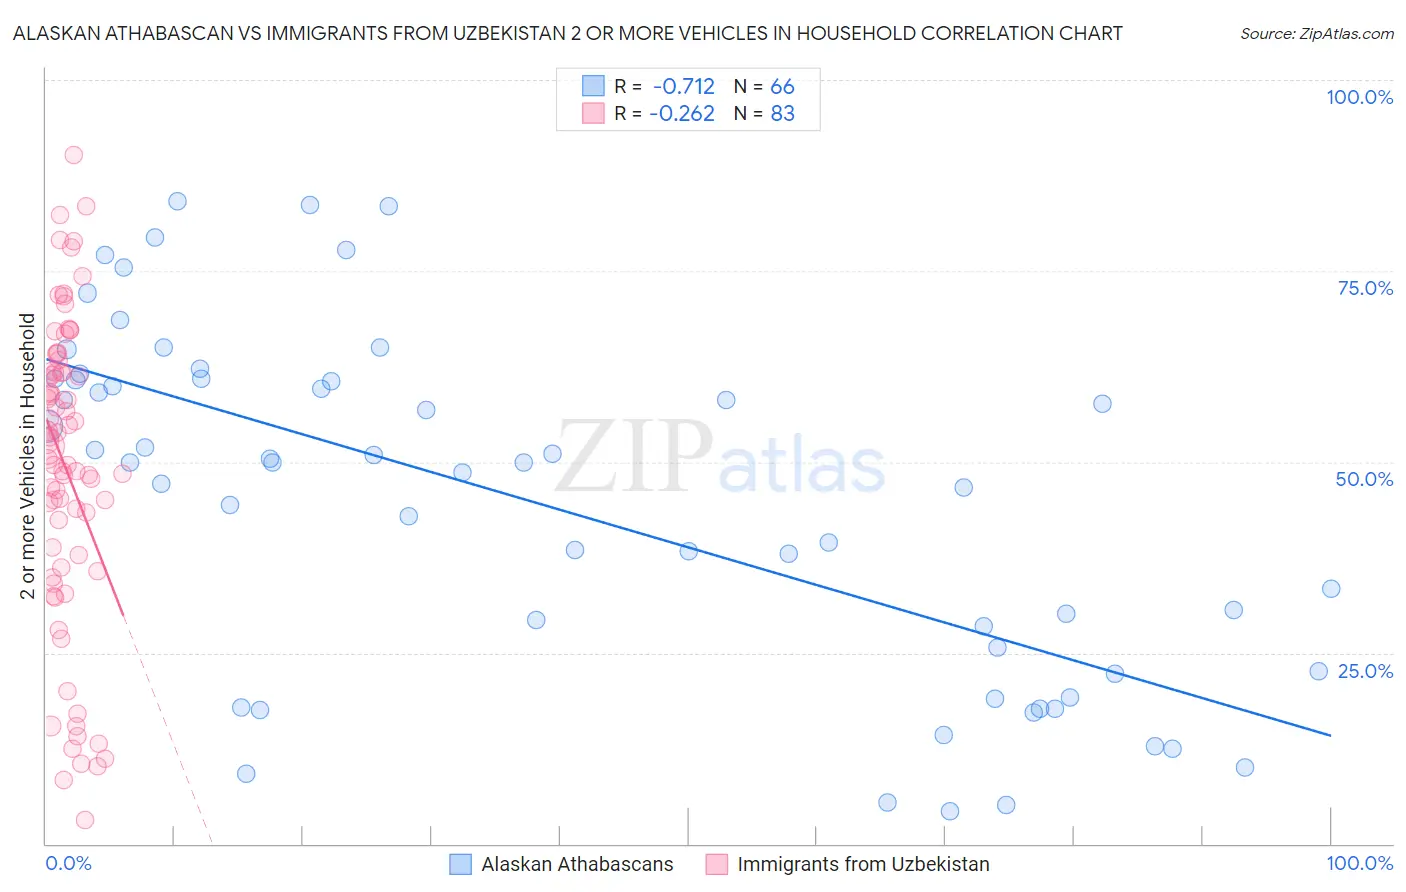
Alaskan Athabascan vs Immigrants from Uzbekistan 2 or more Vehicles in Household Correlation Chart
The statistical analysis conducted on geographies consisting of 45,808,386 people shows a strong negative correlation between the proportion of Alaskan Athabascans and percentage of households with 2 or more vehicles available in the United States with a correlation coefficient (R) of -0.712 and weighted average of 55.2%. Similarly, the statistical analysis conducted on geographies consisting of 118,723,370 people shows a weak negative correlation between the proportion of Immigrants from Uzbekistan and percentage of households with 2 or more vehicles available in the United States with a correlation coefficient (R) of -0.262 and weighted average of 37.9%, a difference of 45.6%.
2 or more Vehicles in Household Correlation Summary
| Measurement | Alaskan Athabascan | Immigrants from Uzbekistan |
| Minimum | 4.3% | 3.0% |
| Maximum | 84.1% | 90.2% |
| Range | 79.8% | 87.1% |
| Mean | 44.5% | 49.1% |
| Median | 50.0% | 52.0% |
| Interquartile 25% (IQ1) | 22.6% | 36.2% |
| Interquartile 75% (IQ3) | 60.8% | 61.9% |
| Interquartile Range (IQR) | 38.2% | 25.7% |
| Standard Deviation (Sample) | 22.4% | 20.0% |
| Standard Deviation (Population) | 22.2% | 19.9% |
Similar Demographics by 2 or more Vehicles in Household
Demographics Similar to Alaskan Athabascans by 2 or more Vehicles in Household
In terms of 2 or more vehicles in household, the demographic groups most similar to Alaskan Athabascans are Immigrants from Sweden (55.2%, a difference of 0.10%), Immigrants from Kenya (55.1%, a difference of 0.11%), Menominee (55.3%, a difference of 0.13%), Immigrants from Cuba (55.3%, a difference of 0.17%), and Immigrants from Micronesia (55.1%, a difference of 0.20%).
| Demographics | Rating | Rank | 2 or more Vehicles in Household |
| Immigrants | Nicaragua | 51.6 /100 | #172 | Average 55.4% |
| Immigrants | Western Europe | 51.4 /100 | #173 | Average 55.4% |
| Navajo | 50.0 /100 | #174 | Average 55.3% |
| Immigrants | Denmark | 49.4 /100 | #175 | Average 55.3% |
| Immigrants | Cuba | 47.0 /100 | #176 | Average 55.3% |
| Menominee | 46.2 /100 | #177 | Average 55.3% |
| Immigrants | Sweden | 45.3 /100 | #178 | Average 55.2% |
| Alaskan Athabascans | 42.9 /100 | #179 | Average 55.2% |
| Immigrants | Kenya | 40.4 /100 | #180 | Average 55.1% |
| Immigrants | Micronesia | 38.2 /100 | #181 | Fair 55.1% |
| Cree | 38.2 /100 | #182 | Fair 55.1% |
| Immigrants | Cameroon | 37.3 /100 | #183 | Fair 55.1% |
| Apache | 36.7 /100 | #184 | Fair 55.1% |
| Arabs | 35.9 /100 | #185 | Fair 55.0% |
| Peruvians | 33.7 /100 | #186 | Fair 55.0% |
Demographics Similar to Immigrants from Uzbekistan by 2 or more Vehicles in Household
In terms of 2 or more vehicles in household, the demographic groups most similar to Immigrants from Uzbekistan are Barbadian (38.3%, a difference of 1.2%), Vietnamese (38.5%, a difference of 1.6%), Immigrants from Bangladesh (38.8%, a difference of 2.3%), Immigrants from Barbados (35.8%, a difference of 5.9%), and Immigrants from Trinidad and Tobago (40.3%, a difference of 6.3%).
| Demographics | Rating | Rank | 2 or more Vehicles in Household |
| West Indians | 0.0 /100 | #331 | Tragic 41.3% |
| Trinidadians and Tobagonians | 0.0 /100 | #332 | Tragic 40.9% |
| Immigrants | Ecuador | 0.0 /100 | #333 | Tragic 40.5% |
| Immigrants | Trinidad and Tobago | 0.0 /100 | #334 | Tragic 40.3% |
| Immigrants | Bangladesh | 0.0 /100 | #335 | Tragic 38.8% |
| Vietnamese | 0.0 /100 | #336 | Tragic 38.5% |
| Barbadians | 0.0 /100 | #337 | Tragic 38.3% |
| Immigrants | Uzbekistan | 0.0 /100 | #338 | Tragic 37.9% |
| Immigrants | Barbados | 0.0 /100 | #339 | Tragic 35.8% |
| British West Indians | 0.0 /100 | #340 | Tragic 35.4% |
| Guyanese | 0.0 /100 | #341 | Tragic 35.4% |
| Dominicans | 0.0 /100 | #342 | Tragic 35.3% |
| Immigrants | Guyana | 0.0 /100 | #343 | Tragic 35.0% |
| Yup'ik | 0.0 /100 | #344 | Tragic 34.9% |
| Immigrants | Dominican Republic | 0.0 /100 | #345 | Tragic 33.2% |