Zimbabwean vs Immigrants from Uzbekistan 2 or more Vehicles in Household
COMPARE
Zimbabwean
Immigrants from Uzbekistan
2 or more Vehicles in Household
2 or more Vehicles in Household Comparison
Zimbabweans
Immigrants from Uzbekistan
57.2%
2 OR MORE VEHICLES IN HOUSEHOLD
96.9/ 100
METRIC RATING
113th/ 347
METRIC RANK
37.9%
2 OR MORE VEHICLES IN HOUSEHOLD
0.0/ 100
METRIC RATING
338th/ 347
METRIC RANK
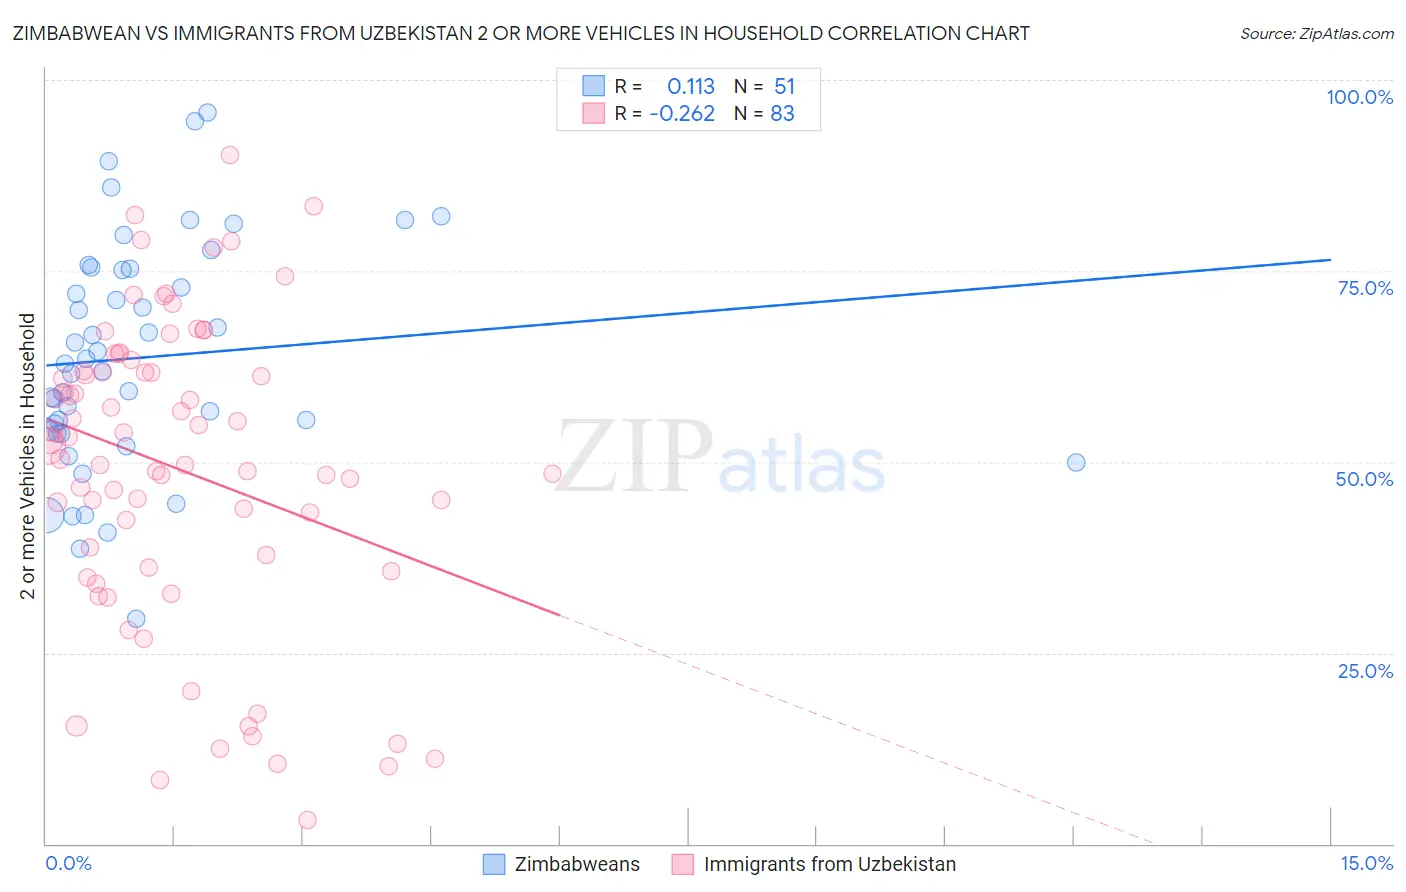
Zimbabwean vs Immigrants from Uzbekistan 2 or more Vehicles in Household Correlation Chart
The statistical analysis conducted on geographies consisting of 69,192,017 people shows a poor positive correlation between the proportion of Zimbabweans and percentage of households with 2 or more vehicles available in the United States with a correlation coefficient (R) of 0.113 and weighted average of 57.2%. Similarly, the statistical analysis conducted on geographies consisting of 118,723,370 people shows a weak negative correlation between the proportion of Immigrants from Uzbekistan and percentage of households with 2 or more vehicles available in the United States with a correlation coefficient (R) of -0.262 and weighted average of 37.9%, a difference of 51.0%.
2 or more Vehicles in Household Correlation Summary
| Measurement | Zimbabwean | Immigrants from Uzbekistan |
| Minimum | 29.5% | 3.0% |
| Maximum | 95.8% | 90.2% |
| Range | 66.3% | 87.1% |
| Mean | 63.7% | 49.1% |
| Median | 62.9% | 52.0% |
| Interquartile 25% (IQ1) | 53.7% | 36.2% |
| Interquartile 75% (IQ3) | 75.3% | 61.9% |
| Interquartile Range (IQR) | 21.6% | 25.7% |
| Standard Deviation (Sample) | 14.9% | 20.0% |
| Standard Deviation (Population) | 14.8% | 19.9% |
Similar Demographics by 2 or more Vehicles in Household
Demographics Similar to Zimbabweans by 2 or more Vehicles in Household
In terms of 2 or more vehicles in household, the demographic groups most similar to Zimbabweans are Immigrants from Lebanon (57.2%, a difference of 0.030%), Chippewa (57.2%, a difference of 0.090%), Immigrants from Jordan (57.2%, a difference of 0.10%), Iraqi (57.1%, a difference of 0.29%), and Greek (57.5%, a difference of 0.42%).
| Demographics | Rating | Rank | 2 or more Vehicles in Household |
| Immigrants | Oceania | 98.2 /100 | #106 | Exceptional 57.5% |
| Immigrants | Netherlands | 98.2 /100 | #107 | Exceptional 57.5% |
| Immigrants | Canada | 98.1 /100 | #108 | Exceptional 57.5% |
| Immigrants | North America | 98.1 /100 | #109 | Exceptional 57.5% |
| Japanese | 98.0 /100 | #110 | Exceptional 57.5% |
| Greeks | 98.0 /100 | #111 | Exceptional 57.5% |
| Pueblo | 98.0 /100 | #112 | Exceptional 57.5% |
| Zimbabweans | 96.9 /100 | #113 | Exceptional 57.2% |
| Immigrants | Lebanon | 96.8 /100 | #114 | Exceptional 57.2% |
| Chippewa | 96.6 /100 | #115 | Exceptional 57.2% |
| Immigrants | Jordan | 96.6 /100 | #116 | Exceptional 57.2% |
| Iraqis | 95.8 /100 | #117 | Exceptional 57.1% |
| Asians | 95.1 /100 | #118 | Exceptional 57.0% |
| Natives/Alaskans | 95.0 /100 | #119 | Exceptional 57.0% |
| Costa Ricans | 94.7 /100 | #120 | Exceptional 56.9% |
Demographics Similar to Immigrants from Uzbekistan by 2 or more Vehicles in Household
In terms of 2 or more vehicles in household, the demographic groups most similar to Immigrants from Uzbekistan are Barbadian (38.3%, a difference of 1.2%), Vietnamese (38.5%, a difference of 1.6%), Immigrants from Bangladesh (38.8%, a difference of 2.3%), Immigrants from Barbados (35.8%, a difference of 5.9%), and Immigrants from Trinidad and Tobago (40.3%, a difference of 6.3%).
| Demographics | Rating | Rank | 2 or more Vehicles in Household |
| West Indians | 0.0 /100 | #331 | Tragic 41.3% |
| Trinidadians and Tobagonians | 0.0 /100 | #332 | Tragic 40.9% |
| Immigrants | Ecuador | 0.0 /100 | #333 | Tragic 40.5% |
| Immigrants | Trinidad and Tobago | 0.0 /100 | #334 | Tragic 40.3% |
| Immigrants | Bangladesh | 0.0 /100 | #335 | Tragic 38.8% |
| Vietnamese | 0.0 /100 | #336 | Tragic 38.5% |
| Barbadians | 0.0 /100 | #337 | Tragic 38.3% |
| Immigrants | Uzbekistan | 0.0 /100 | #338 | Tragic 37.9% |
| Immigrants | Barbados | 0.0 /100 | #339 | Tragic 35.8% |
| British West Indians | 0.0 /100 | #340 | Tragic 35.4% |
| Guyanese | 0.0 /100 | #341 | Tragic 35.4% |
| Dominicans | 0.0 /100 | #342 | Tragic 35.3% |
| Immigrants | Guyana | 0.0 /100 | #343 | Tragic 35.0% |
| Yup'ik | 0.0 /100 | #344 | Tragic 34.9% |
| Immigrants | Dominican Republic | 0.0 /100 | #345 | Tragic 33.2% |