Chinese vs Immigrants from Uzbekistan 2 or more Vehicles in Household
COMPARE
Chinese
Immigrants from Uzbekistan
2 or more Vehicles in Household
2 or more Vehicles in Household Comparison
Chinese
Immigrants from Uzbekistan
60.1%
2 OR MORE VEHICLES IN HOUSEHOLD
100.0/ 100
METRIC RATING
36th/ 347
METRIC RANK
37.9%
2 OR MORE VEHICLES IN HOUSEHOLD
0.0/ 100
METRIC RATING
338th/ 347
METRIC RANK
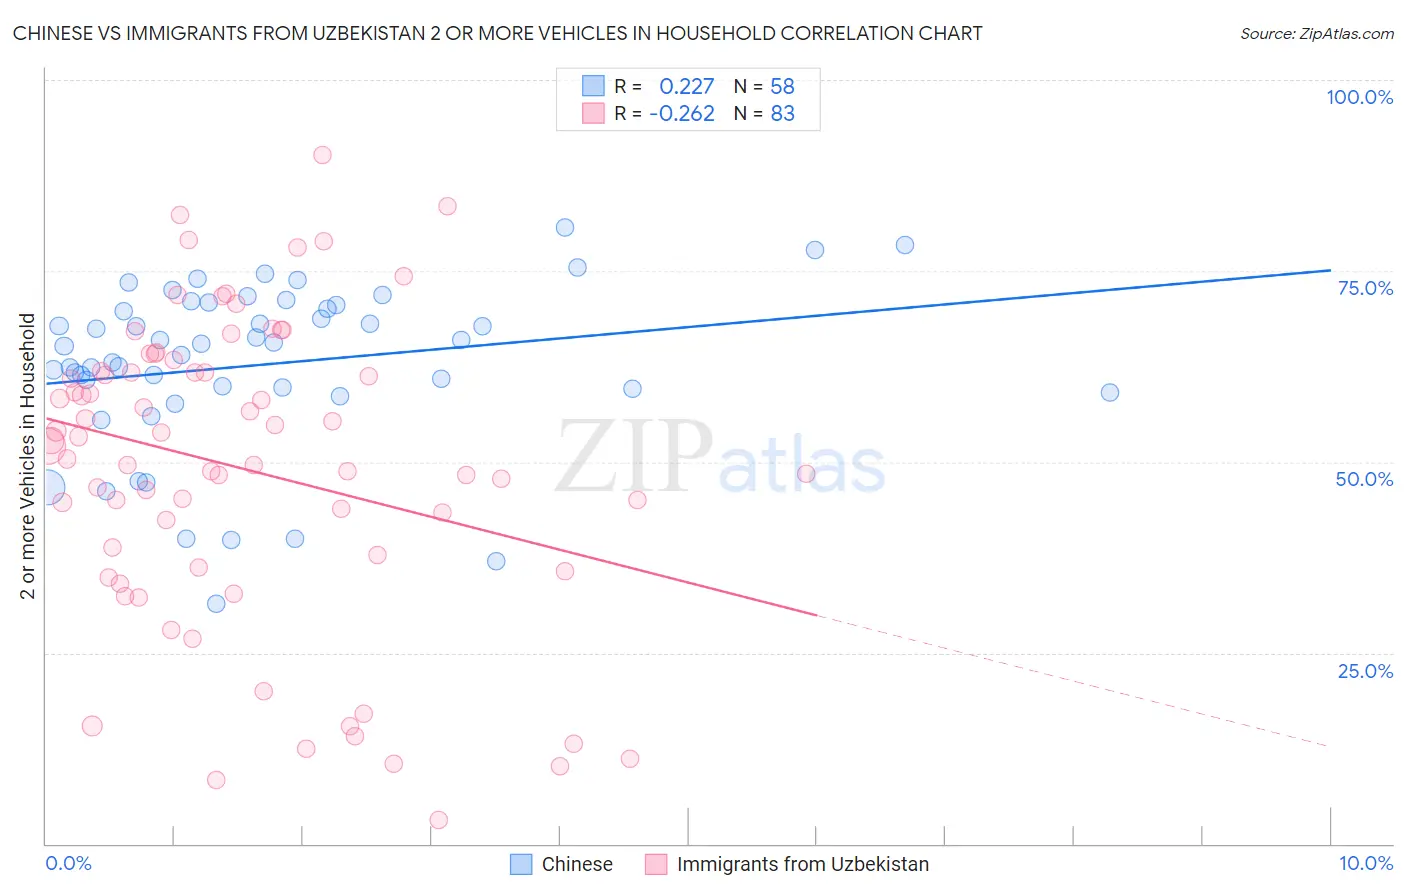
Chinese vs Immigrants from Uzbekistan 2 or more Vehicles in Household Correlation Chart
The statistical analysis conducted on geographies consisting of 64,802,428 people shows a weak positive correlation between the proportion of Chinese and percentage of households with 2 or more vehicles available in the United States with a correlation coefficient (R) of 0.227 and weighted average of 60.1%. Similarly, the statistical analysis conducted on geographies consisting of 118,723,370 people shows a weak negative correlation between the proportion of Immigrants from Uzbekistan and percentage of households with 2 or more vehicles available in the United States with a correlation coefficient (R) of -0.262 and weighted average of 37.9%, a difference of 58.6%.
2 or more Vehicles in Household Correlation Summary
| Measurement | Chinese | Immigrants from Uzbekistan |
| Minimum | 31.5% | 3.0% |
| Maximum | 80.6% | 90.2% |
| Range | 49.2% | 87.1% |
| Mean | 62.8% | 49.1% |
| Median | 65.3% | 52.0% |
| Interquartile 25% (IQ1) | 59.5% | 36.2% |
| Interquartile 75% (IQ3) | 70.6% | 61.9% |
| Interquartile Range (IQR) | 11.1% | 25.7% |
| Standard Deviation (Sample) | 10.9% | 20.0% |
| Standard Deviation (Population) | 10.8% | 19.9% |
Similar Demographics by 2 or more Vehicles in Household
Demographics Similar to Chinese by 2 or more Vehicles in Household
In terms of 2 or more vehicles in household, the demographic groups most similar to Chinese are Immigrants from Philippines (60.1%, a difference of 0.020%), Irish (60.1%, a difference of 0.030%), American (60.0%, a difference of 0.10%), British (60.0%, a difference of 0.10%), and Spanish (60.2%, a difference of 0.14%).
| Demographics | Rating | Rank | 2 or more Vehicles in Household |
| Hawaiians | 100.0 /100 | #29 | Exceptional 60.4% |
| Finns | 100.0 /100 | #30 | Exceptional 60.3% |
| Spanish American Indians | 100.0 /100 | #31 | Exceptional 60.3% |
| Arapaho | 100.0 /100 | #32 | Exceptional 60.2% |
| Immigrants | Mexico | 100.0 /100 | #33 | Exceptional 60.2% |
| Spanish | 100.0 /100 | #34 | Exceptional 60.2% |
| Immigrants | Philippines | 100.0 /100 | #35 | Exceptional 60.1% |
| Chinese | 100.0 /100 | #36 | Exceptional 60.1% |
| Irish | 100.0 /100 | #37 | Exceptional 60.1% |
| Americans | 100.0 /100 | #38 | Exceptional 60.0% |
| British | 100.0 /100 | #39 | Exceptional 60.0% |
| Cherokee | 100.0 /100 | #40 | Exceptional 59.9% |
| Northern Europeans | 100.0 /100 | #41 | Exceptional 59.9% |
| Malaysians | 100.0 /100 | #42 | Exceptional 59.8% |
| Czechoslovakians | 100.0 /100 | #43 | Exceptional 59.8% |
Demographics Similar to Immigrants from Uzbekistan by 2 or more Vehicles in Household
In terms of 2 or more vehicles in household, the demographic groups most similar to Immigrants from Uzbekistan are Barbadian (38.3%, a difference of 1.2%), Vietnamese (38.5%, a difference of 1.6%), Immigrants from Bangladesh (38.8%, a difference of 2.3%), Immigrants from Barbados (35.8%, a difference of 5.9%), and Immigrants from Trinidad and Tobago (40.3%, a difference of 6.3%).
| Demographics | Rating | Rank | 2 or more Vehicles in Household |
| West Indians | 0.0 /100 | #331 | Tragic 41.3% |
| Trinidadians and Tobagonians | 0.0 /100 | #332 | Tragic 40.9% |
| Immigrants | Ecuador | 0.0 /100 | #333 | Tragic 40.5% |
| Immigrants | Trinidad and Tobago | 0.0 /100 | #334 | Tragic 40.3% |
| Immigrants | Bangladesh | 0.0 /100 | #335 | Tragic 38.8% |
| Vietnamese | 0.0 /100 | #336 | Tragic 38.5% |
| Barbadians | 0.0 /100 | #337 | Tragic 38.3% |
| Immigrants | Uzbekistan | 0.0 /100 | #338 | Tragic 37.9% |
| Immigrants | Barbados | 0.0 /100 | #339 | Tragic 35.8% |
| British West Indians | 0.0 /100 | #340 | Tragic 35.4% |
| Guyanese | 0.0 /100 | #341 | Tragic 35.4% |
| Dominicans | 0.0 /100 | #342 | Tragic 35.3% |
| Immigrants | Guyana | 0.0 /100 | #343 | Tragic 35.0% |
| Yup'ik | 0.0 /100 | #344 | Tragic 34.9% |
| Immigrants | Dominican Republic | 0.0 /100 | #345 | Tragic 33.2% |