British West Indian vs Immigrants from El Salvador 2 or more Vehicles in Household
COMPARE
British West Indian
Immigrants from El Salvador
2 or more Vehicles in Household
2 or more Vehicles in Household Comparison
British West Indians
Immigrants from El Salvador
35.4%
2 OR MORE VEHICLES IN HOUSEHOLD
0.0/ 100
METRIC RATING
340th/ 347
METRIC RANK
55.6%
2 OR MORE VEHICLES IN HOUSEHOLD
59.4/ 100
METRIC RATING
165th/ 347
METRIC RANK
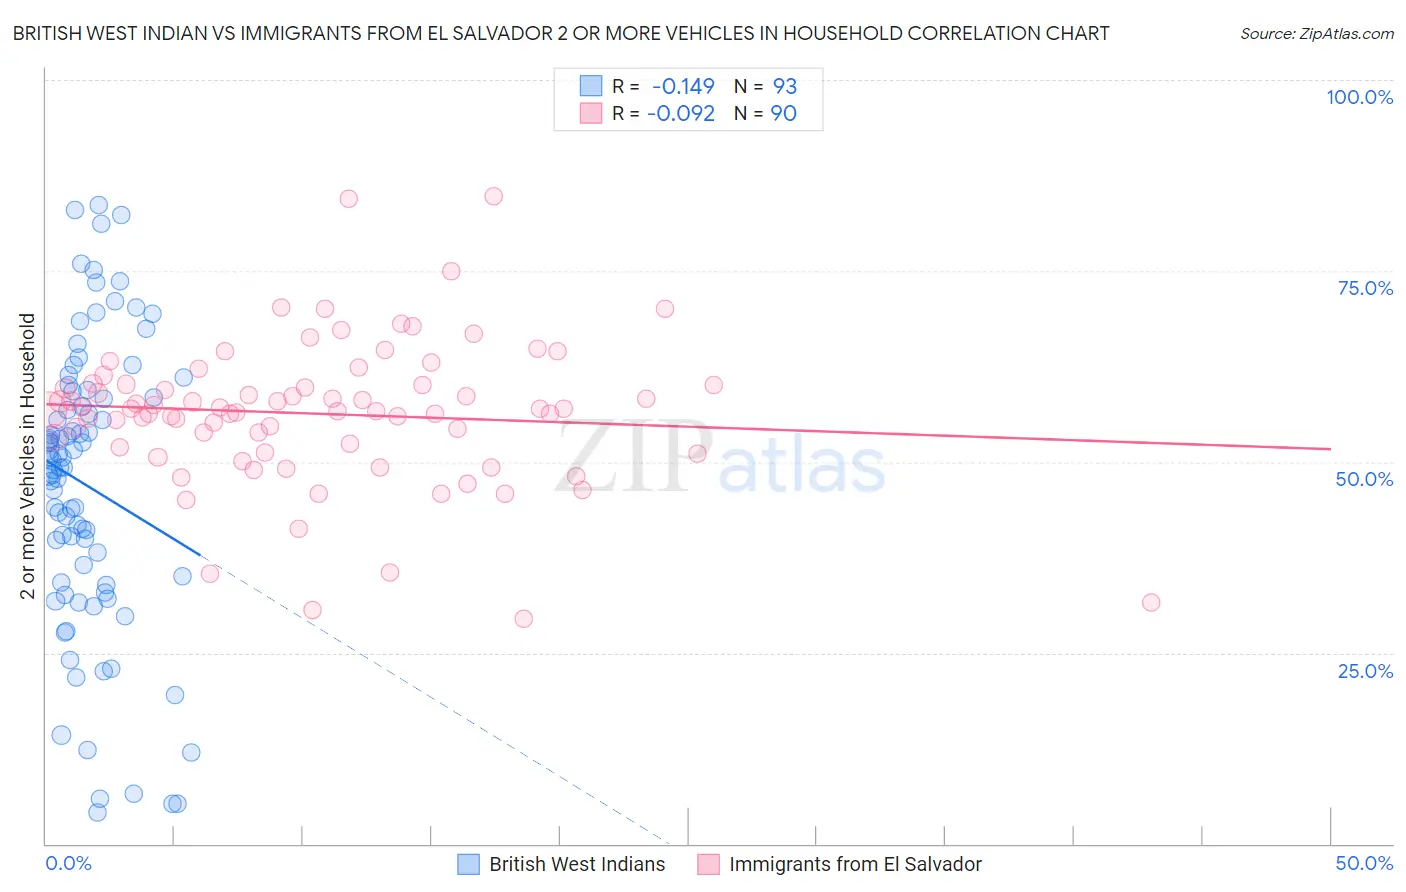
British West Indian vs Immigrants from El Salvador 2 or more Vehicles in Household Correlation Chart
The statistical analysis conducted on geographies consisting of 152,636,759 people shows a poor negative correlation between the proportion of British West Indians and percentage of households with 2 or more vehicles available in the United States with a correlation coefficient (R) of -0.149 and weighted average of 35.4%. Similarly, the statistical analysis conducted on geographies consisting of 357,715,134 people shows a slight negative correlation between the proportion of Immigrants from El Salvador and percentage of households with 2 or more vehicles available in the United States with a correlation coefficient (R) of -0.092 and weighted average of 55.6%, a difference of 56.9%.
2 or more Vehicles in Household Correlation Summary
| Measurement | British West Indian | Immigrants from El Salvador |
| Minimum | 4.2% | 29.5% |
| Maximum | 83.7% | 84.8% |
| Range | 79.5% | 55.4% |
| Mean | 46.8% | 56.3% |
| Median | 49.3% | 56.8% |
| Interquartile 25% (IQ1) | 34.0% | 51.9% |
| Interquartile 75% (IQ3) | 58.8% | 60.1% |
| Interquartile Range (IQR) | 24.8% | 8.1% |
| Standard Deviation (Sample) | 18.9% | 9.5% |
| Standard Deviation (Population) | 18.8% | 9.4% |
Similar Demographics by 2 or more Vehicles in Household
Demographics Similar to British West Indians by 2 or more Vehicles in Household
In terms of 2 or more vehicles in household, the demographic groups most similar to British West Indians are Guyanese (35.4%, a difference of 0.070%), Dominican (35.3%, a difference of 0.25%), Immigrants from Barbados (35.8%, a difference of 1.1%), Immigrants from Guyana (35.0%, a difference of 1.1%), and Yup'ik (34.9%, a difference of 1.3%).
| Demographics | Rating | Rank | 2 or more Vehicles in Household |
| Immigrants | Ecuador | 0.0 /100 | #333 | Tragic 40.5% |
| Immigrants | Trinidad and Tobago | 0.0 /100 | #334 | Tragic 40.3% |
| Immigrants | Bangladesh | 0.0 /100 | #335 | Tragic 38.8% |
| Vietnamese | 0.0 /100 | #336 | Tragic 38.5% |
| Barbadians | 0.0 /100 | #337 | Tragic 38.3% |
| Immigrants | Uzbekistan | 0.0 /100 | #338 | Tragic 37.9% |
| Immigrants | Barbados | 0.0 /100 | #339 | Tragic 35.8% |
| British West Indians | 0.0 /100 | #340 | Tragic 35.4% |
| Guyanese | 0.0 /100 | #341 | Tragic 35.4% |
| Dominicans | 0.0 /100 | #342 | Tragic 35.3% |
| Immigrants | Guyana | 0.0 /100 | #343 | Tragic 35.0% |
| Yup'ik | 0.0 /100 | #344 | Tragic 34.9% |
| Immigrants | Dominican Republic | 0.0 /100 | #345 | Tragic 33.2% |
| Immigrants | St. Vincent and the Grenadines | 0.0 /100 | #346 | Tragic 31.0% |
| Immigrants | Grenada | 0.0 /100 | #347 | Tragic 28.7% |
Demographics Similar to Immigrants from El Salvador by 2 or more Vehicles in Household
In terms of 2 or more vehicles in household, the demographic groups most similar to Immigrants from El Salvador are Dutch West Indian (55.6%, a difference of 0.020%), Immigrants from Zimbabwe (55.6%, a difference of 0.030%), Immigrants from Sri Lanka (55.5%, a difference of 0.040%), Kenyan (55.5%, a difference of 0.050%), and German Russian (55.6%, a difference of 0.060%).
| Demographics | Rating | Rank | 2 or more Vehicles in Household |
| Tlingit-Haida | 68.5 /100 | #158 | Good 55.8% |
| Paiute | 68.0 /100 | #159 | Good 55.8% |
| Crow | 67.0 /100 | #160 | Good 55.7% |
| Colville | 61.1 /100 | #161 | Good 55.6% |
| German Russians | 60.9 /100 | #162 | Good 55.6% |
| Immigrants | Zimbabwe | 60.2 /100 | #163 | Good 55.6% |
| Dutch West Indians | 59.8 /100 | #164 | Average 55.6% |
| Immigrants | El Salvador | 59.4 /100 | #165 | Average 55.6% |
| Immigrants | Sri Lanka | 58.3 /100 | #166 | Average 55.5% |
| Kenyans | 58.1 /100 | #167 | Average 55.5% |
| French American Indians | 56.7 /100 | #168 | Average 55.5% |
| Immigrants | Austria | 56.3 /100 | #169 | Average 55.5% |
| Romanians | 55.8 /100 | #170 | Average 55.5% |
| Immigrants | Costa Rica | 54.4 /100 | #171 | Average 55.4% |
| Immigrants | Nicaragua | 51.6 /100 | #172 | Average 55.4% |