Immigrants from Latvia vs Immigrants from El Salvador Ambulatory Disability
COMPARE
Immigrants from Latvia
Immigrants from El Salvador
Ambulatory Disability
Ambulatory Disability Comparison
Immigrants from Latvia
Immigrants from El Salvador
6.0%
AMBULATORY DISABILITY
71.1/ 100
METRIC RATING
159th/ 347
METRIC RANK
5.8%
AMBULATORY DISABILITY
98.4/ 100
METRIC RATING
95th/ 347
METRIC RANK
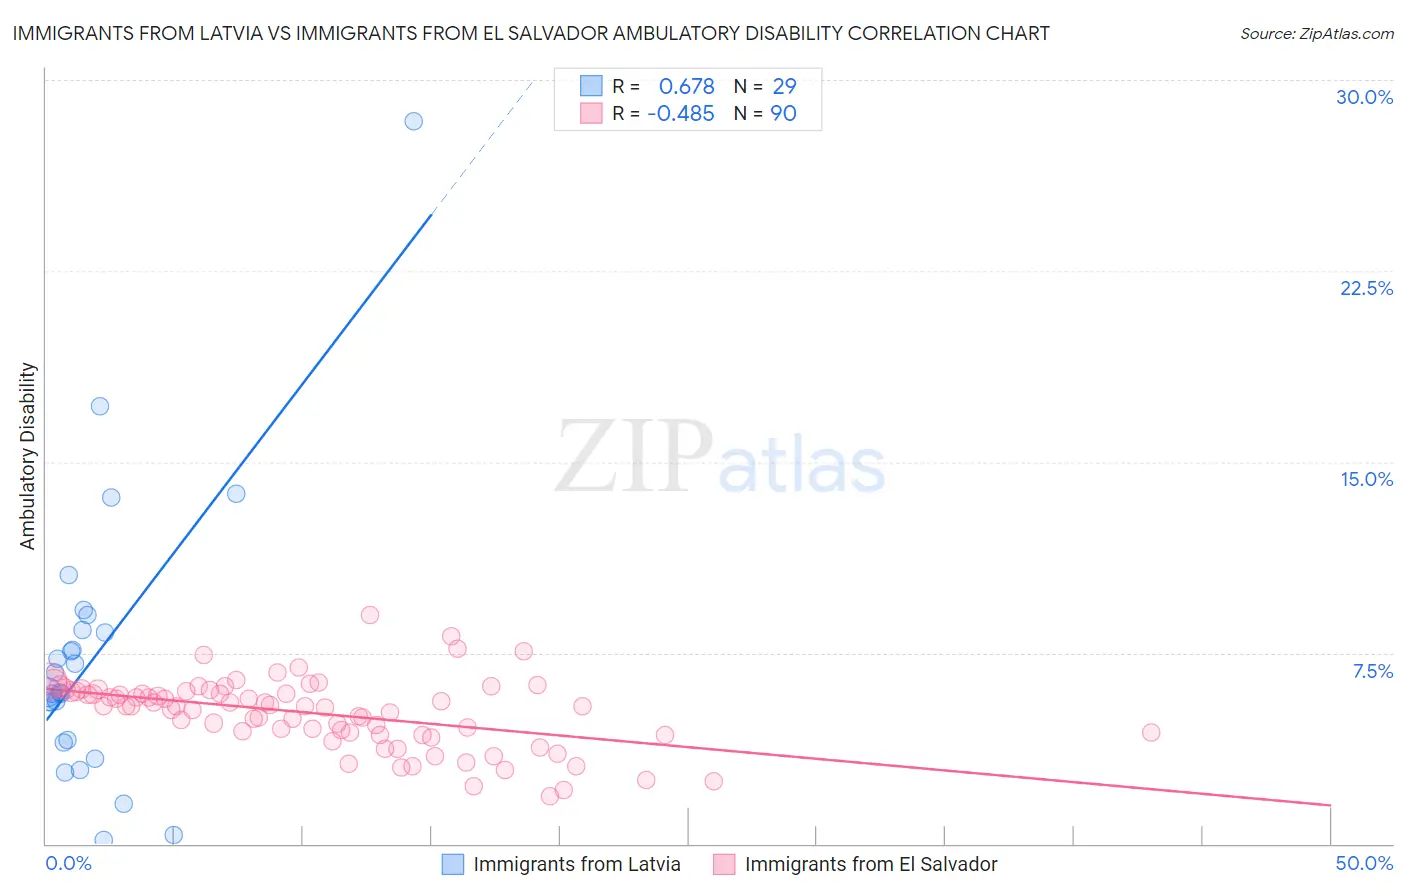
Immigrants from Latvia vs Immigrants from El Salvador Ambulatory Disability Correlation Chart
The statistical analysis conducted on geographies consisting of 113,736,193 people shows a significant positive correlation between the proportion of Immigrants from Latvia and percentage of population with ambulatory disability in the United States with a correlation coefficient (R) of 0.678 and weighted average of 6.0%. Similarly, the statistical analysis conducted on geographies consisting of 357,732,482 people shows a moderate negative correlation between the proportion of Immigrants from El Salvador and percentage of population with ambulatory disability in the United States with a correlation coefficient (R) of -0.485 and weighted average of 5.8%, a difference of 4.5%.
Ambulatory Disability Correlation Summary
| Measurement | Immigrants from Latvia | Immigrants from El Salvador |
| Minimum | 0.16% | 1.9% |
| Maximum | 28.4% | 9.0% |
| Range | 28.2% | 7.1% |
| Mean | 7.4% | 5.1% |
| Median | 6.0% | 5.4% |
| Interquartile 25% (IQ1) | 4.0% | 4.4% |
| Interquartile 75% (IQ3) | 8.7% | 6.0% |
| Interquartile Range (IQR) | 4.7% | 1.6% |
| Standard Deviation (Sample) | 5.6% | 1.4% |
| Standard Deviation (Population) | 5.5% | 1.4% |
Similar Demographics by Ambulatory Disability
Demographics Similar to Immigrants from Latvia by Ambulatory Disability
In terms of ambulatory disability, the demographic groups most similar to Immigrants from Latvia are Immigrants from Fiji (6.0%, a difference of 0.010%), Ghanaian (6.0%, a difference of 0.020%), Northern European (6.0%, a difference of 0.050%), Immigrants from Scotland (6.0%, a difference of 0.070%), and Central American (6.0%, a difference of 0.080%).
| Demographics | Rating | Rank | Ambulatory Disability |
| Immigrants | Austria | 78.8 /100 | #152 | Good 6.0% |
| Syrians | 75.5 /100 | #153 | Good 6.0% |
| Immigrants | Croatia | 75.1 /100 | #154 | Good 6.0% |
| Immigrants | Scotland | 72.1 /100 | #155 | Good 6.0% |
| Northern Europeans | 71.8 /100 | #156 | Good 6.0% |
| Ghanaians | 71.3 /100 | #157 | Good 6.0% |
| Immigrants | Fiji | 71.2 /100 | #158 | Good 6.0% |
| Immigrants | Latvia | 71.1 /100 | #159 | Good 6.0% |
| Central Americans | 69.8 /100 | #160 | Good 6.0% |
| Immigrants | Belarus | 69.2 /100 | #161 | Good 6.1% |
| Nigerians | 67.1 /100 | #162 | Good 6.1% |
| Lebanese | 66.2 /100 | #163 | Good 6.1% |
| Basques | 63.7 /100 | #164 | Good 6.1% |
| Nicaraguans | 63.2 /100 | #165 | Good 6.1% |
| Iraqis | 62.8 /100 | #166 | Good 6.1% |
Demographics Similar to Immigrants from El Salvador by Ambulatory Disability
In terms of ambulatory disability, the demographic groups most similar to Immigrants from El Salvador are Salvadoran (5.8%, a difference of 0.020%), Kenyan (5.8%, a difference of 0.040%), Immigrants from Somalia (5.8%, a difference of 0.060%), Immigrants from Lebanon (5.8%, a difference of 0.090%), and Immigrants from Northern Europe (5.8%, a difference of 0.17%).
| Demographics | Rating | Rank | Ambulatory Disability |
| Soviet Union | 98.9 /100 | #88 | Exceptional 5.8% |
| Bhutanese | 98.8 /100 | #89 | Exceptional 5.8% |
| Australians | 98.8 /100 | #90 | Exceptional 5.8% |
| Immigrants | Sudan | 98.8 /100 | #91 | Exceptional 5.8% |
| Immigrants | Sierra Leone | 98.6 /100 | #92 | Exceptional 5.8% |
| Immigrants | Denmark | 98.6 /100 | #93 | Exceptional 5.8% |
| Kenyans | 98.4 /100 | #94 | Exceptional 5.8% |
| Immigrants | El Salvador | 98.4 /100 | #95 | Exceptional 5.8% |
| Salvadorans | 98.4 /100 | #96 | Exceptional 5.8% |
| Immigrants | Somalia | 98.3 /100 | #97 | Exceptional 5.8% |
| Immigrants | Lebanon | 98.3 /100 | #98 | Exceptional 5.8% |
| Immigrants | Northern Europe | 98.2 /100 | #99 | Exceptional 5.8% |
| Immigrants | Serbia | 97.9 /100 | #100 | Exceptional 5.8% |
| Immigrants | South America | 97.9 /100 | #101 | Exceptional 5.8% |
| Immigrants | Kenya | 97.8 /100 | #102 | Exceptional 5.8% |