Hmong vs Spaniard 3 or more Vehicles in Household
COMPARE
Hmong
Spaniard
3 or more Vehicles in Household
3 or more Vehicles in Household Comparison
Hmong
Spaniards
21.0%
3 OR MORE VEHICLES IN HOUSEHOLD
98.2/ 100
METRIC RATING
98th/ 347
METRIC RANK
22.3%
3 OR MORE VEHICLES IN HOUSEHOLD
100.0/ 100
METRIC RATING
58th/ 347
METRIC RANK
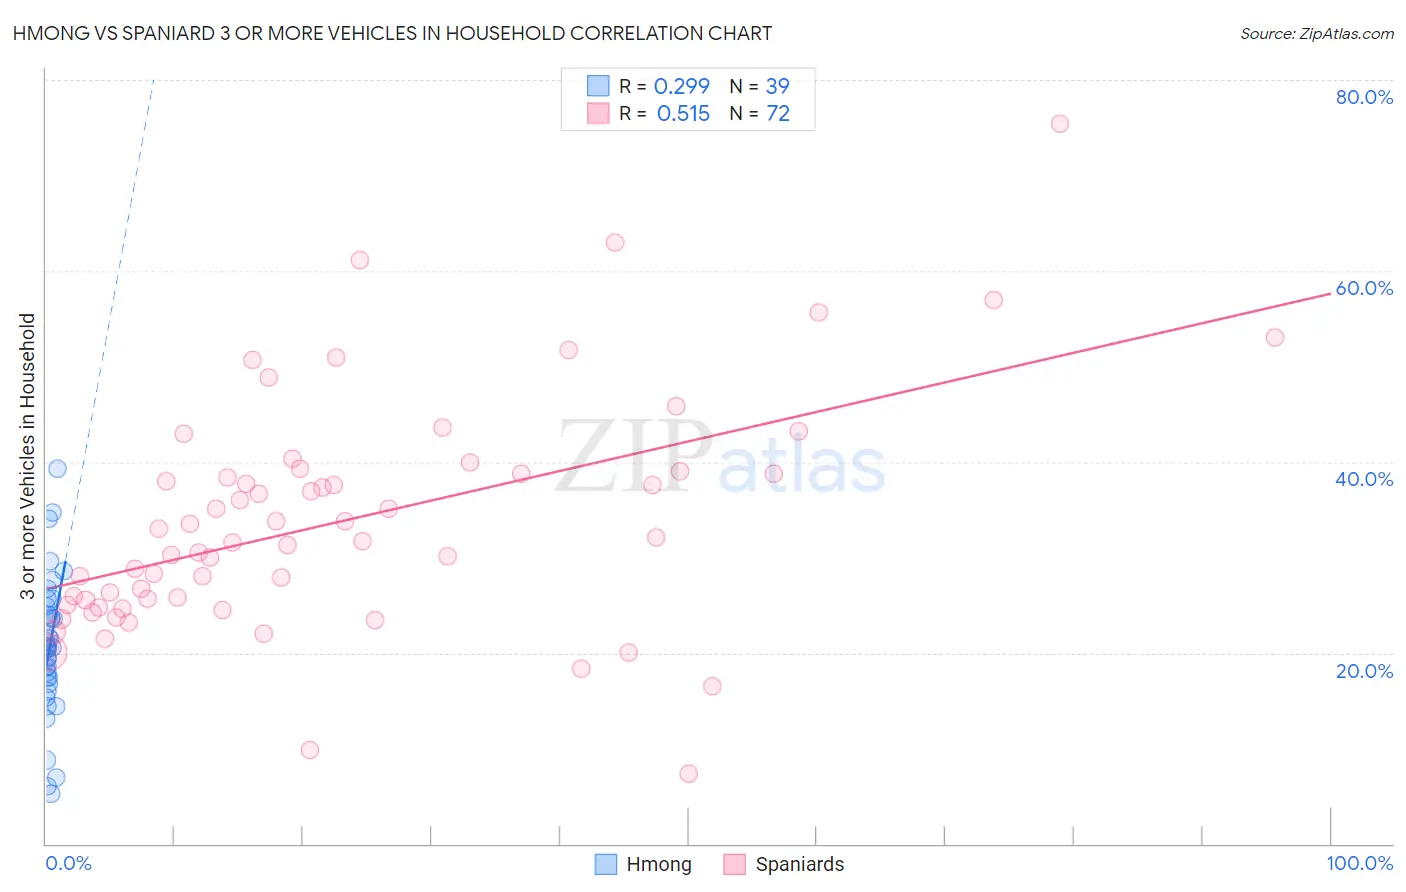
Hmong vs Spaniard 3 or more Vehicles in Household Correlation Chart
The statistical analysis conducted on geographies consisting of 24,678,157 people shows a weak positive correlation between the proportion of Hmong and percentage of households with 3 or more vehicles available in the United States with a correlation coefficient (R) of 0.299 and weighted average of 21.0%. Similarly, the statistical analysis conducted on geographies consisting of 443,028,178 people shows a substantial positive correlation between the proportion of Spaniards and percentage of households with 3 or more vehicles available in the United States with a correlation coefficient (R) of 0.515 and weighted average of 22.3%, a difference of 6.3%.
3 or more Vehicles in Household Correlation Summary
| Measurement | Hmong | Spaniard |
| Minimum | 5.2% | 7.3% |
| Maximum | 39.3% | 75.5% |
| Range | 34.1% | 68.2% |
| Mean | 20.6% | 33.9% |
| Median | 20.6% | 31.9% |
| Interquartile 25% (IQ1) | 16.7% | 25.3% |
| Interquartile 75% (IQ3) | 24.8% | 38.9% |
| Interquartile Range (IQR) | 8.1% | 13.6% |
| Standard Deviation (Sample) | 7.4% | 12.2% |
| Standard Deviation (Population) | 7.3% | 12.2% |
Similar Demographics by 3 or more Vehicles in Household
Demographics Similar to Hmong by 3 or more Vehicles in Household
In terms of 3 or more vehicles in household, the demographic groups most similar to Hmong are Alaska Native (21.0%, a difference of 0.0%), Comanche (21.0%, a difference of 0.040%), Canadian (21.0%, a difference of 0.060%), Cree (21.0%, a difference of 0.16%), and Pakistani (21.0%, a difference of 0.26%).
| Demographics | Rating | Rank | 3 or more Vehicles in Household |
| Belgians | 98.9 /100 | #91 | Exceptional 21.2% |
| Apache | 98.9 /100 | #92 | Exceptional 21.2% |
| Immigrants | Indonesia | 98.8 /100 | #93 | Exceptional 21.1% |
| Immigrants | Cambodia | 98.6 /100 | #94 | Exceptional 21.1% |
| Pakistanis | 98.5 /100 | #95 | Exceptional 21.0% |
| Cree | 98.4 /100 | #96 | Exceptional 21.0% |
| Canadians | 98.3 /100 | #97 | Exceptional 21.0% |
| Hmong | 98.2 /100 | #98 | Exceptional 21.0% |
| Alaska Natives | 98.2 /100 | #99 | Exceptional 21.0% |
| Comanche | 98.2 /100 | #100 | Exceptional 21.0% |
| Blackfeet | 97.9 /100 | #101 | Exceptional 20.9% |
| Seminole | 97.8 /100 | #102 | Exceptional 20.9% |
| Dutch West Indians | 97.8 /100 | #103 | Exceptional 20.9% |
| Luxembourgers | 97.7 /100 | #104 | Exceptional 20.9% |
| Austrians | 97.5 /100 | #105 | Exceptional 20.9% |
Demographics Similar to Spaniards by 3 or more Vehicles in Household
In terms of 3 or more vehicles in household, the demographic groups most similar to Spaniards are Navajo (22.3%, a difference of 0.060%), Pennsylvania German (22.3%, a difference of 0.13%), Finnish (22.3%, a difference of 0.15%), Hispanic or Latino (22.4%, a difference of 0.29%), and Bhutanese (22.2%, a difference of 0.30%).
| Demographics | Rating | Rank | 3 or more Vehicles in Household |
| Whites/Caucasians | 100.0 /100 | #51 | Exceptional 22.6% |
| Welsh | 100.0 /100 | #52 | Exceptional 22.6% |
| Czechs | 100.0 /100 | #53 | Exceptional 22.5% |
| Crow | 100.0 /100 | #54 | Exceptional 22.5% |
| Immigrants | Laos | 100.0 /100 | #55 | Exceptional 22.4% |
| Hispanics or Latinos | 100.0 /100 | #56 | Exceptional 22.4% |
| Pennsylvania Germans | 100.0 /100 | #57 | Exceptional 22.3% |
| Spaniards | 100.0 /100 | #58 | Exceptional 22.3% |
| Navajo | 100.0 /100 | #59 | Exceptional 22.3% |
| Finns | 99.9 /100 | #60 | Exceptional 22.3% |
| Bhutanese | 99.9 /100 | #61 | Exceptional 22.2% |
| Fijians | 99.9 /100 | #62 | Exceptional 22.2% |
| Chickasaw | 99.9 /100 | #63 | Exceptional 22.2% |
| Immigrants | Taiwan | 99.9 /100 | #64 | Exceptional 22.1% |
| Pima | 99.9 /100 | #65 | Exceptional 22.0% |