Belgian vs Arab 1 or more Vehicles in Household
COMPARE
Belgian
Arab
1 or more Vehicles in Household
1 or more Vehicles in Household Comparison
Belgians
Arabs
92.1%
1 OR MORE VEHICLES IN HOUSEHOLD
99.9/ 100
METRIC RATING
48th/ 347
METRIC RANK
89.6%
1 OR MORE VEHICLES IN HOUSEHOLD
43.3/ 100
METRIC RATING
180th/ 347
METRIC RANK
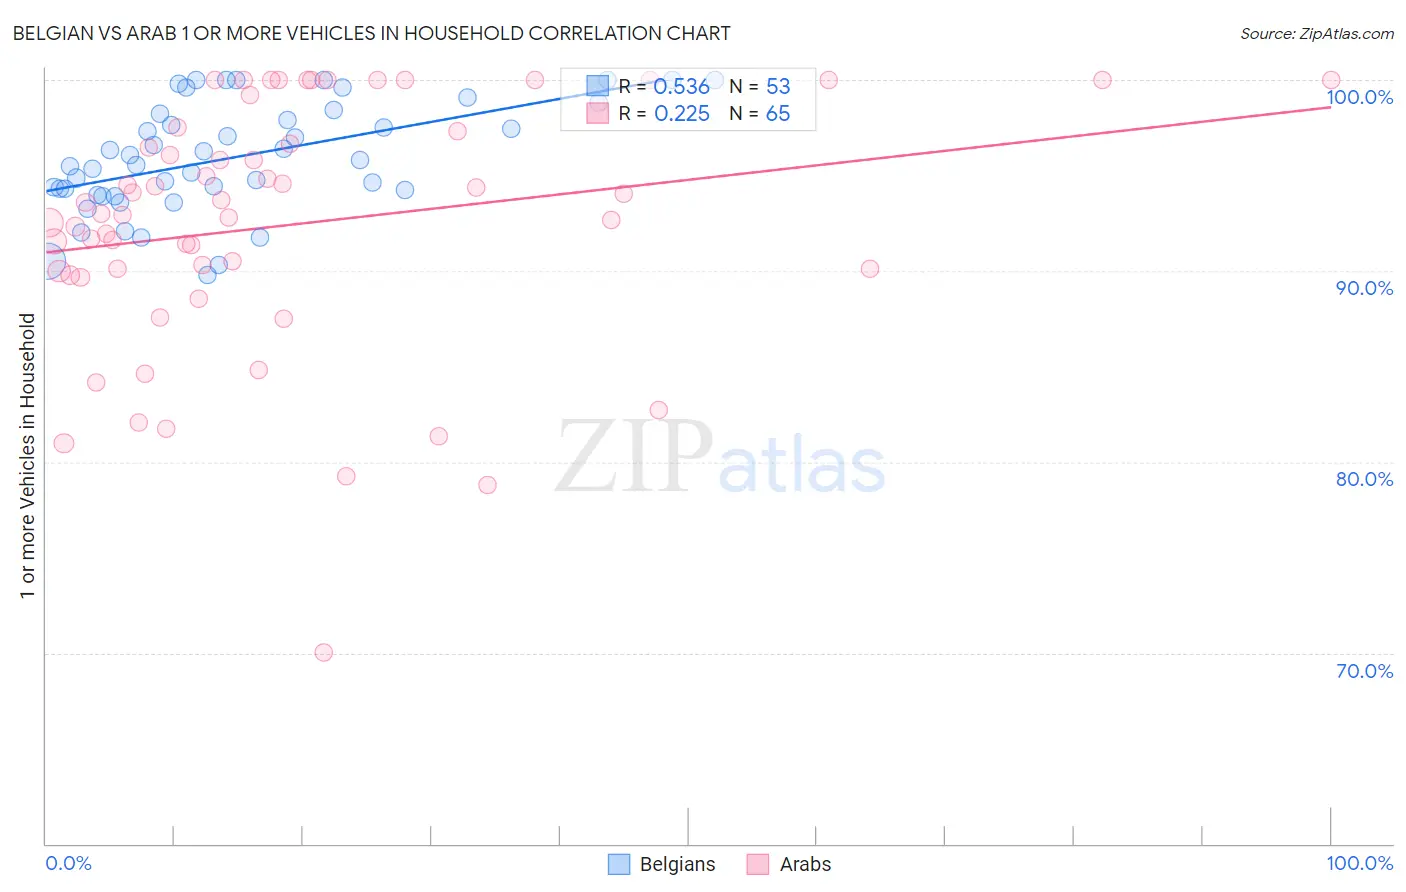
Belgian vs Arab 1 or more Vehicles in Household Correlation Chart
The statistical analysis conducted on geographies consisting of 355,873,468 people shows a substantial positive correlation between the proportion of Belgians and percentage of households with 1 or more vehicles available in the United States with a correlation coefficient (R) of 0.536 and weighted average of 92.1%. Similarly, the statistical analysis conducted on geographies consisting of 486,370,240 people shows a weak positive correlation between the proportion of Arabs and percentage of households with 1 or more vehicles available in the United States with a correlation coefficient (R) of 0.225 and weighted average of 89.6%, a difference of 2.8%.
1 or more Vehicles in Household Correlation Summary
| Measurement | Belgian | Arab |
| Minimum | 89.8% | 70.0% |
| Maximum | 100.0% | 100.0% |
| Range | 10.2% | 30.0% |
| Mean | 96.0% | 92.4% |
| Median | 95.8% | 93.0% |
| Interquartile 25% (IQ1) | 94.1% | 89.9% |
| Interquartile 75% (IQ3) | 98.3% | 97.4% |
| Interquartile Range (IQR) | 4.2% | 7.5% |
| Standard Deviation (Sample) | 2.8% | 6.5% |
| Standard Deviation (Population) | 2.8% | 6.5% |
Similar Demographics by 1 or more Vehicles in Household
Demographics Similar to Belgians by 1 or more Vehicles in Household
In terms of 1 or more vehicles in household, the demographic groups most similar to Belgians are Afghan (92.1%, a difference of 0.010%), Guamanian/Chamorro (92.1%, a difference of 0.020%), Celtic (92.1%, a difference of 0.030%), Korean (92.1%, a difference of 0.060%), and Immigrants from Fiji (92.2%, a difference of 0.090%).
| Demographics | Rating | Rank | 1 or more Vehicles in Household |
| Immigrants | Taiwan | 99.9 /100 | #41 | Exceptional 92.3% |
| Chickasaw | 99.9 /100 | #42 | Exceptional 92.3% |
| Spanish | 99.9 /100 | #43 | Exceptional 92.3% |
| Choctaw | 99.9 /100 | #44 | Exceptional 92.2% |
| Immigrants | Nonimmigrants | 99.9 /100 | #45 | Exceptional 92.2% |
| Immigrants | Fiji | 99.9 /100 | #46 | Exceptional 92.2% |
| Northern Europeans | 99.9 /100 | #47 | Exceptional 92.2% |
| Belgians | 99.9 /100 | #48 | Exceptional 92.1% |
| Afghans | 99.9 /100 | #49 | Exceptional 92.1% |
| Guamanians/Chamorros | 99.9 /100 | #50 | Exceptional 92.1% |
| Celtics | 99.9 /100 | #51 | Exceptional 92.1% |
| Koreans | 99.9 /100 | #52 | Exceptional 92.1% |
| Hawaiians | 99.9 /100 | #53 | Exceptional 92.0% |
| Slovenes | 99.9 /100 | #54 | Exceptional 92.0% |
| Immigrants | Afghanistan | 99.9 /100 | #55 | Exceptional 92.0% |
Demographics Similar to Arabs by 1 or more Vehicles in Household
In terms of 1 or more vehicles in household, the demographic groups most similar to Arabs are Immigrants from El Salvador (89.6%, a difference of 0.010%), German Russian (89.6%, a difference of 0.010%), Immigrants from Ethiopia (89.6%, a difference of 0.010%), Ukrainian (89.6%, a difference of 0.010%), and Ethiopian (89.6%, a difference of 0.030%).
| Demographics | Rating | Rank | 1 or more Vehicles in Household |
| Lumbee | 52.8 /100 | #173 | Average 89.7% |
| Filipinos | 50.0 /100 | #174 | Average 89.7% |
| Immigrants | Burma/Myanmar | 47.6 /100 | #175 | Average 89.7% |
| Immigrants | Sudan | 47.1 /100 | #176 | Average 89.7% |
| Hmong | 45.8 /100 | #177 | Average 89.6% |
| Immigrants | El Salvador | 44.1 /100 | #178 | Average 89.6% |
| German Russians | 44.0 /100 | #179 | Average 89.6% |
| Arabs | 43.3 /100 | #180 | Average 89.6% |
| Immigrants | Ethiopia | 42.5 /100 | #181 | Average 89.6% |
| Ukrainians | 42.4 /100 | #182 | Average 89.6% |
| Ethiopians | 41.2 /100 | #183 | Average 89.6% |
| Immigrants | Bulgaria | 40.7 /100 | #184 | Average 89.6% |
| Immigrants | Brazil | 40.1 /100 | #185 | Average 89.6% |
| Pueblo | 39.9 /100 | #186 | Fair 89.6% |
| South Americans | 39.6 /100 | #187 | Fair 89.5% |