Argentinean vs Arab 1 or more Vehicles in Household
COMPARE
Argentinean
Arab
1 or more Vehicles in Household
1 or more Vehicles in Household Comparison
Argentineans
Arabs
88.9%
1 OR MORE VEHICLES IN HOUSEHOLD
8.8/ 100
METRIC RATING
217th/ 347
METRIC RANK
89.6%
1 OR MORE VEHICLES IN HOUSEHOLD
43.3/ 100
METRIC RATING
180th/ 347
METRIC RANK
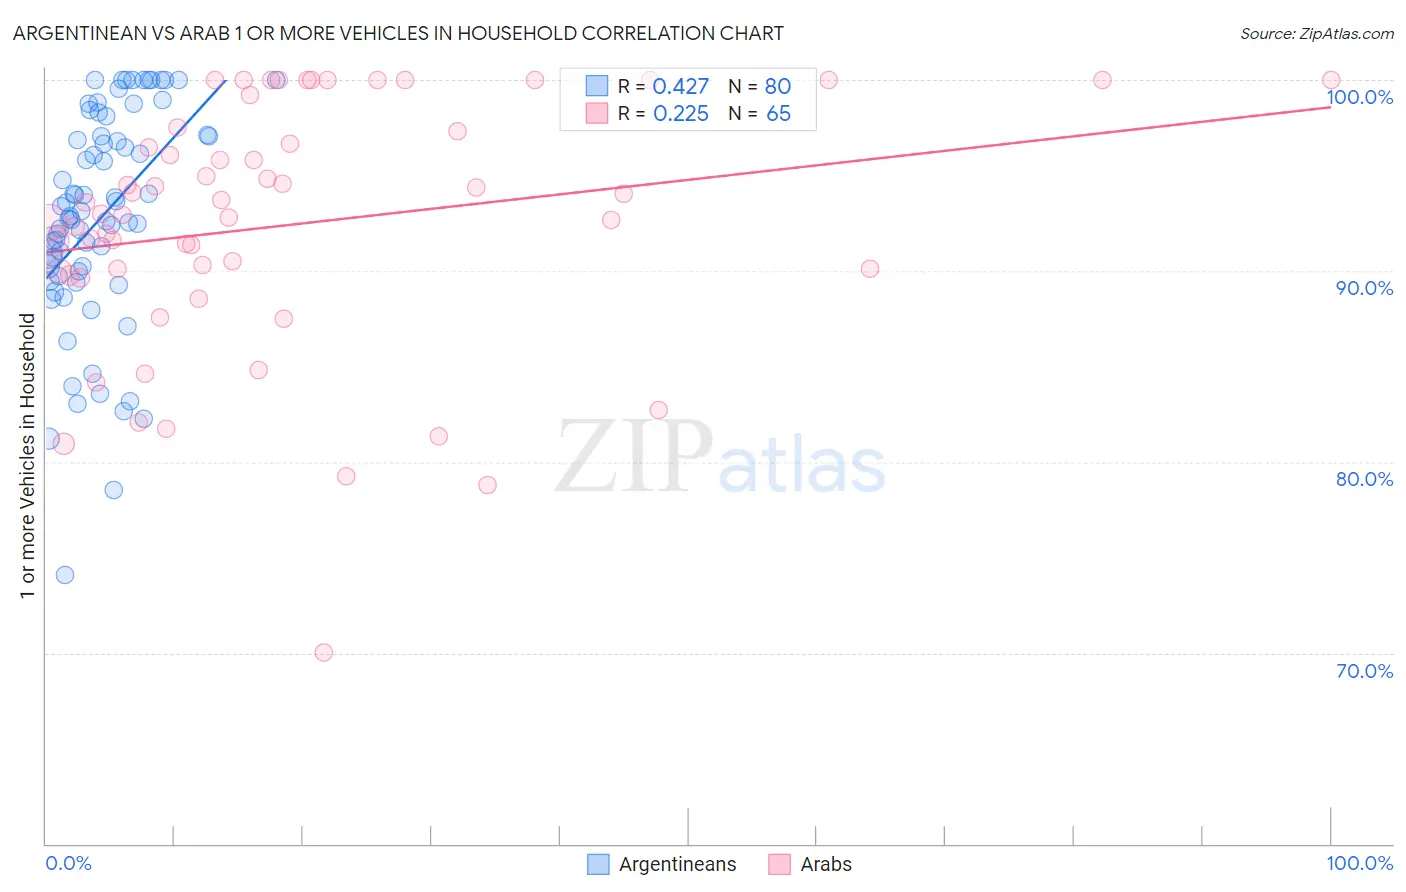
Argentinean vs Arab 1 or more Vehicles in Household Correlation Chart
The statistical analysis conducted on geographies consisting of 297,015,008 people shows a moderate positive correlation between the proportion of Argentineans and percentage of households with 1 or more vehicles available in the United States with a correlation coefficient (R) of 0.427 and weighted average of 88.9%. Similarly, the statistical analysis conducted on geographies consisting of 486,370,240 people shows a weak positive correlation between the proportion of Arabs and percentage of households with 1 or more vehicles available in the United States with a correlation coefficient (R) of 0.225 and weighted average of 89.6%, a difference of 0.81%.
1 or more Vehicles in Household Correlation Summary
| Measurement | Argentinean | Arab |
| Minimum | 74.1% | 70.0% |
| Maximum | 100.0% | 100.0% |
| Range | 25.9% | 30.0% |
| Mean | 92.8% | 92.4% |
| Median | 93.0% | 93.0% |
| Interquartile 25% (IQ1) | 89.9% | 89.9% |
| Interquartile 75% (IQ3) | 97.1% | 97.4% |
| Interquartile Range (IQR) | 7.2% | 7.5% |
| Standard Deviation (Sample) | 5.7% | 6.5% |
| Standard Deviation (Population) | 5.7% | 6.5% |
Similar Demographics by 1 or more Vehicles in Household
Demographics Similar to Argentineans by 1 or more Vehicles in Household
In terms of 1 or more vehicles in household, the demographic groups most similar to Argentineans are Ugandan (88.9%, a difference of 0.010%), Immigrants from Guatemala (88.9%, a difference of 0.010%), Immigrants from Argentina (88.9%, a difference of 0.030%), Immigrants from Zaire (88.8%, a difference of 0.040%), and Peruvian (88.8%, a difference of 0.050%).
| Demographics | Rating | Rank | 1 or more Vehicles in Household |
| Dutch West Indians | 13.5 /100 | #210 | Poor 89.0% |
| Sierra Leoneans | 13.0 /100 | #211 | Poor 89.0% |
| Somalis | 12.8 /100 | #212 | Poor 89.0% |
| Immigrants | Western Asia | 12.3 /100 | #213 | Poor 89.0% |
| Immigrants | Hungary | 11.9 /100 | #214 | Poor 89.0% |
| Immigrants | Sri Lanka | 10.2 /100 | #215 | Poor 88.9% |
| Immigrants | Argentina | 9.4 /100 | #216 | Tragic 88.9% |
| Argentineans | 8.8 /100 | #217 | Tragic 88.9% |
| Ugandans | 8.7 /100 | #218 | Tragic 88.9% |
| Immigrants | Guatemala | 8.6 /100 | #219 | Tragic 88.9% |
| Immigrants | Zaire | 8.1 /100 | #220 | Tragic 88.8% |
| Peruvians | 7.9 /100 | #221 | Tragic 88.8% |
| Uruguayans | 7.0 /100 | #222 | Tragic 88.8% |
| Immigrants | South America | 7.0 /100 | #223 | Tragic 88.8% |
| Immigrants | Hong Kong | 6.2 /100 | #224 | Tragic 88.7% |
Demographics Similar to Arabs by 1 or more Vehicles in Household
In terms of 1 or more vehicles in household, the demographic groups most similar to Arabs are Immigrants from El Salvador (89.6%, a difference of 0.010%), German Russian (89.6%, a difference of 0.010%), Immigrants from Ethiopia (89.6%, a difference of 0.010%), Ukrainian (89.6%, a difference of 0.010%), and Ethiopian (89.6%, a difference of 0.030%).
| Demographics | Rating | Rank | 1 or more Vehicles in Household |
| Lumbee | 52.8 /100 | #173 | Average 89.7% |
| Filipinos | 50.0 /100 | #174 | Average 89.7% |
| Immigrants | Burma/Myanmar | 47.6 /100 | #175 | Average 89.7% |
| Immigrants | Sudan | 47.1 /100 | #176 | Average 89.7% |
| Hmong | 45.8 /100 | #177 | Average 89.6% |
| Immigrants | El Salvador | 44.1 /100 | #178 | Average 89.6% |
| German Russians | 44.0 /100 | #179 | Average 89.6% |
| Arabs | 43.3 /100 | #180 | Average 89.6% |
| Immigrants | Ethiopia | 42.5 /100 | #181 | Average 89.6% |
| Ukrainians | 42.4 /100 | #182 | Average 89.6% |
| Ethiopians | 41.2 /100 | #183 | Average 89.6% |
| Immigrants | Bulgaria | 40.7 /100 | #184 | Average 89.6% |
| Immigrants | Brazil | 40.1 /100 | #185 | Average 89.6% |
| Pueblo | 39.9 /100 | #186 | Fair 89.6% |
| South Americans | 39.6 /100 | #187 | Fair 89.5% |