Japanese vs Arab 1 or more Vehicles in Household
COMPARE
Japanese
Arab
1 or more Vehicles in Household
1 or more Vehicles in Household Comparison
Japanese
Arabs
90.6%
1 OR MORE VEHICLES IN HOUSEHOLD
93.4/ 100
METRIC RATING
118th/ 347
METRIC RANK
89.6%
1 OR MORE VEHICLES IN HOUSEHOLD
43.3/ 100
METRIC RATING
180th/ 347
METRIC RANK
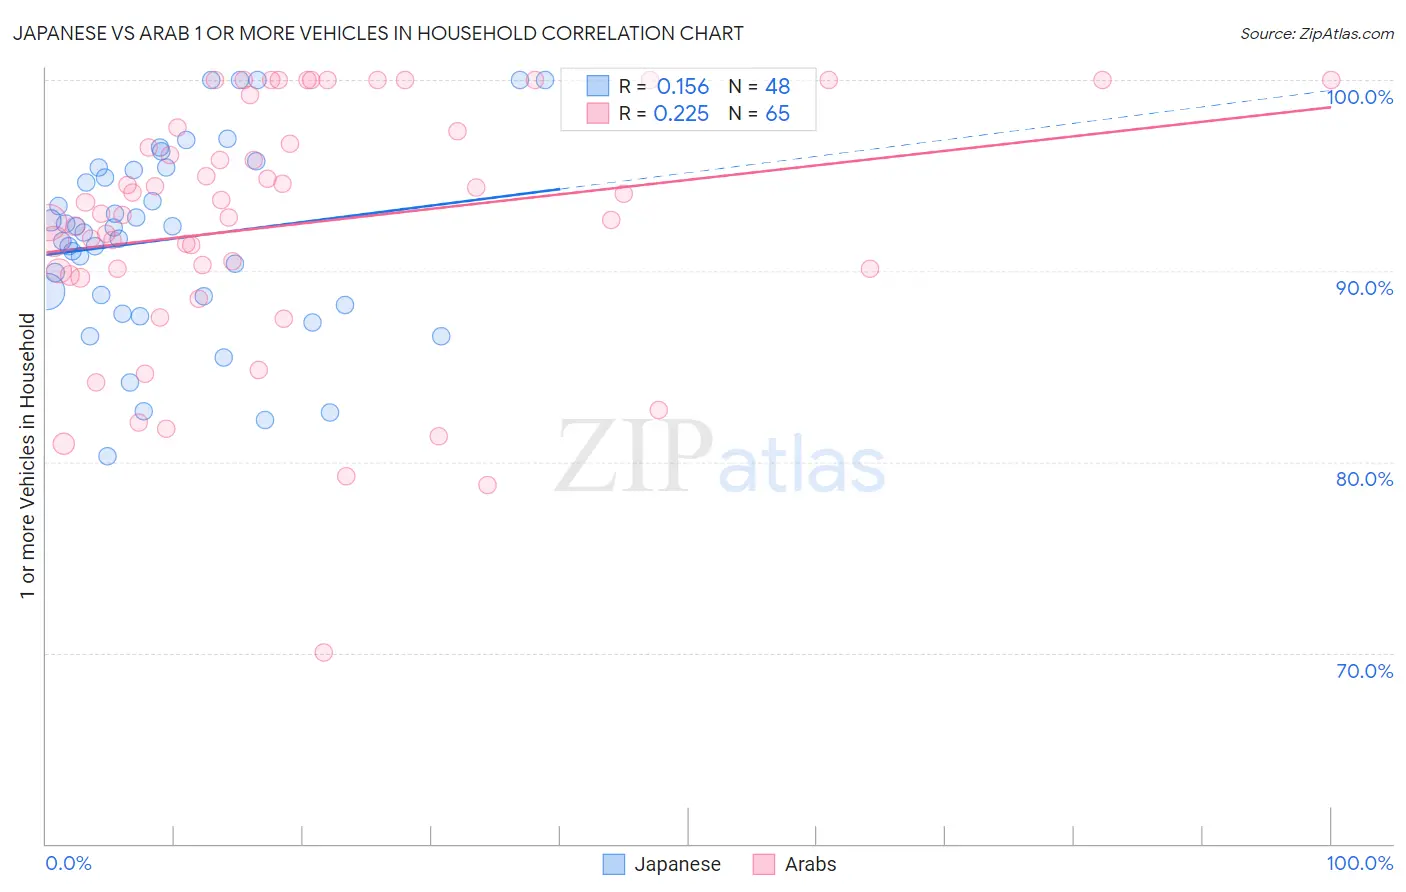
Japanese vs Arab 1 or more Vehicles in Household Correlation Chart
The statistical analysis conducted on geographies consisting of 249,114,886 people shows a poor positive correlation between the proportion of Japanese and percentage of households with 1 or more vehicles available in the United States with a correlation coefficient (R) of 0.156 and weighted average of 90.6%. Similarly, the statistical analysis conducted on geographies consisting of 486,370,240 people shows a weak positive correlation between the proportion of Arabs and percentage of households with 1 or more vehicles available in the United States with a correlation coefficient (R) of 0.225 and weighted average of 89.6%, a difference of 1.1%.
1 or more Vehicles in Household Correlation Summary
| Measurement | Japanese | Arab |
| Minimum | 80.3% | 70.0% |
| Maximum | 100.0% | 100.0% |
| Range | 19.7% | 30.0% |
| Mean | 91.7% | 92.4% |
| Median | 92.1% | 93.0% |
| Interquartile 25% (IQ1) | 88.4% | 89.9% |
| Interquartile 75% (IQ3) | 95.3% | 97.4% |
| Interquartile Range (IQR) | 6.9% | 7.5% |
| Standard Deviation (Sample) | 5.0% | 6.5% |
| Standard Deviation (Population) | 4.9% | 6.5% |
Similar Demographics by 1 or more Vehicles in Household
Demographics Similar to Japanese by 1 or more Vehicles in Household
In terms of 1 or more vehicles in household, the demographic groups most similar to Japanese are Greek (90.6%, a difference of 0.010%), Blackfeet (90.6%, a difference of 0.050%), Serbian (90.7%, a difference of 0.060%), Chippewa (90.7%, a difference of 0.060%), and Immigrants from Thailand (90.6%, a difference of 0.070%).
| Demographics | Rating | Rank | 1 or more Vehicles in Household |
| Navajo | 95.8 /100 | #111 | Exceptional 90.8% |
| Immigrants | Netherlands | 95.7 /100 | #112 | Exceptional 90.8% |
| Immigrants | Kuwait | 94.7 /100 | #113 | Exceptional 90.7% |
| Armenians | 94.5 /100 | #114 | Exceptional 90.7% |
| Serbians | 94.3 /100 | #115 | Exceptional 90.7% |
| Chippewa | 94.3 /100 | #116 | Exceptional 90.7% |
| Greeks | 93.5 /100 | #117 | Exceptional 90.6% |
| Japanese | 93.4 /100 | #118 | Exceptional 90.6% |
| Blackfeet | 92.6 /100 | #119 | Exceptional 90.6% |
| Immigrants | Thailand | 92.3 /100 | #120 | Exceptional 90.6% |
| Icelanders | 92.1 /100 | #121 | Exceptional 90.5% |
| Costa Ricans | 92.0 /100 | #122 | Exceptional 90.5% |
| Fijians | 91.8 /100 | #123 | Exceptional 90.5% |
| Puget Sound Salish | 91.5 /100 | #124 | Exceptional 90.5% |
| Immigrants | Korea | 90.5 /100 | #125 | Exceptional 90.5% |
Demographics Similar to Arabs by 1 or more Vehicles in Household
In terms of 1 or more vehicles in household, the demographic groups most similar to Arabs are Immigrants from El Salvador (89.6%, a difference of 0.010%), German Russian (89.6%, a difference of 0.010%), Immigrants from Ethiopia (89.6%, a difference of 0.010%), Ukrainian (89.6%, a difference of 0.010%), and Ethiopian (89.6%, a difference of 0.030%).
| Demographics | Rating | Rank | 1 or more Vehicles in Household |
| Lumbee | 52.8 /100 | #173 | Average 89.7% |
| Filipinos | 50.0 /100 | #174 | Average 89.7% |
| Immigrants | Burma/Myanmar | 47.6 /100 | #175 | Average 89.7% |
| Immigrants | Sudan | 47.1 /100 | #176 | Average 89.7% |
| Hmong | 45.8 /100 | #177 | Average 89.6% |
| Immigrants | El Salvador | 44.1 /100 | #178 | Average 89.6% |
| German Russians | 44.0 /100 | #179 | Average 89.6% |
| Arabs | 43.3 /100 | #180 | Average 89.6% |
| Immigrants | Ethiopia | 42.5 /100 | #181 | Average 89.6% |
| Ukrainians | 42.4 /100 | #182 | Average 89.6% |
| Ethiopians | 41.2 /100 | #183 | Average 89.6% |
| Immigrants | Bulgaria | 40.7 /100 | #184 | Average 89.6% |
| Immigrants | Brazil | 40.1 /100 | #185 | Average 89.6% |
| Pueblo | 39.9 /100 | #186 | Fair 89.6% |
| South Americans | 39.6 /100 | #187 | Fair 89.5% |