Immigrants from China vs Panamanian 3 or more Vehicles in Household
COMPARE
Immigrants from China
Panamanian
3 or more Vehicles in Household
3 or more Vehicles in Household Comparison
Immigrants from China
Panamanians
18.2%
3 OR MORE VEHICLES IN HOUSEHOLD
2.9/ 100
METRIC RATING
240th/ 347
METRIC RANK
18.8%
3 OR MORE VEHICLES IN HOUSEHOLD
11.6/ 100
METRIC RATING
212th/ 347
METRIC RANK
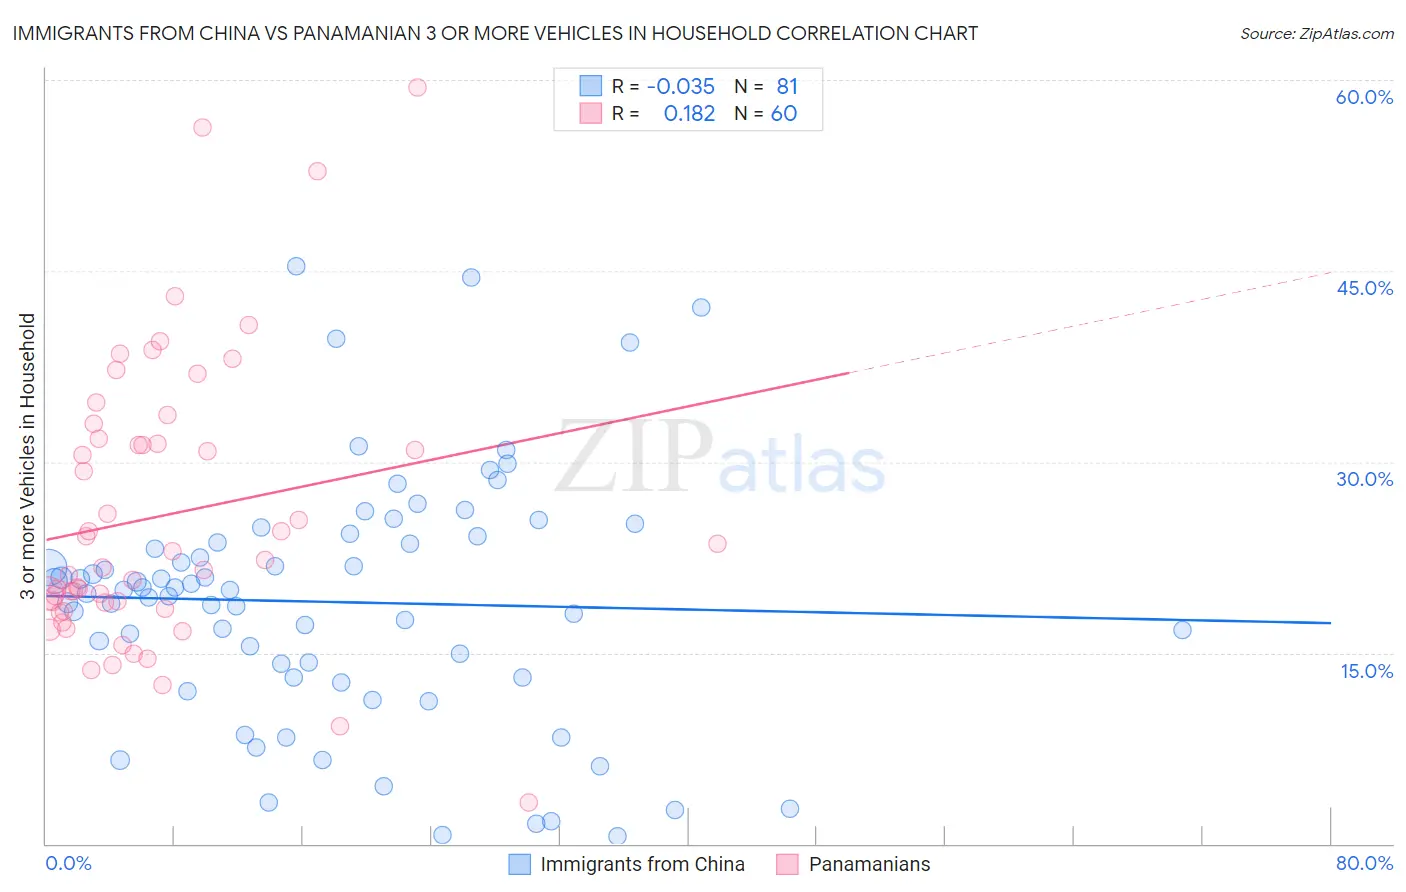
Immigrants from China vs Panamanian 3 or more Vehicles in Household Correlation Chart
The statistical analysis conducted on geographies consisting of 456,383,621 people shows no correlation between the proportion of Immigrants from China and percentage of households with 3 or more vehicles available in the United States with a correlation coefficient (R) of -0.035 and weighted average of 18.2%. Similarly, the statistical analysis conducted on geographies consisting of 281,018,762 people shows a poor positive correlation between the proportion of Panamanians and percentage of households with 3 or more vehicles available in the United States with a correlation coefficient (R) of 0.182 and weighted average of 18.8%, a difference of 3.0%.
3 or more Vehicles in Household Correlation Summary
| Measurement | Immigrants from China | Panamanian |
| Minimum | 0.62% | 3.2% |
| Maximum | 45.4% | 59.4% |
| Range | 44.8% | 56.1% |
| Mean | 19.0% | 25.7% |
| Median | 19.9% | 22.0% |
| Interquartile 25% (IQ1) | 13.0% | 18.7% |
| Interquartile 75% (IQ3) | 23.9% | 31.6% |
| Interquartile Range (IQR) | 10.9% | 12.9% |
| Standard Deviation (Sample) | 9.7% | 11.1% |
| Standard Deviation (Population) | 9.6% | 11.0% |
Similar Demographics by 3 or more Vehicles in Household
Demographics Similar to Immigrants from China by 3 or more Vehicles in Household
In terms of 3 or more vehicles in household, the demographic groups most similar to Immigrants from China are Immigrants from Honduras (18.2%, a difference of 0.13%), Immigrants from Middle Africa (18.2%, a difference of 0.13%), African (18.2%, a difference of 0.20%), Hopi (18.2%, a difference of 0.31%), and Indonesian (18.3%, a difference of 0.36%).
| Demographics | Rating | Rank | 3 or more Vehicles in Household |
| Hondurans | 4.6 /100 | #233 | Tragic 18.4% |
| Immigrants | North Macedonia | 4.4 /100 | #234 | Tragic 18.4% |
| Sierra Leoneans | 3.9 /100 | #235 | Tragic 18.3% |
| Immigrants | Malaysia | 3.6 /100 | #236 | Tragic 18.3% |
| Indonesians | 3.5 /100 | #237 | Tragic 18.3% |
| Immigrants | Honduras | 3.1 /100 | #238 | Tragic 18.2% |
| Immigrants | Middle Africa | 3.1 /100 | #239 | Tragic 18.2% |
| Immigrants | China | 2.9 /100 | #240 | Tragic 18.2% |
| Africans | 2.7 /100 | #241 | Tragic 18.2% |
| Hopi | 2.5 /100 | #242 | Tragic 18.2% |
| Immigrants | Europe | 2.4 /100 | #243 | Tragic 18.1% |
| Mongolians | 2.3 /100 | #244 | Tragic 18.1% |
| Immigrants | Belize | 2.1 /100 | #245 | Tragic 18.1% |
| Immigrants | Australia | 2.0 /100 | #246 | Tragic 18.1% |
| Carpatho Rusyns | 1.9 /100 | #247 | Tragic 18.0% |
Demographics Similar to Panamanians by 3 or more Vehicles in Household
In terms of 3 or more vehicles in household, the demographic groups most similar to Panamanians are Immigrants from Cuba (18.8%, a difference of 0.010%), Immigrants from Kenya (18.8%, a difference of 0.14%), Immigrants from Sierra Leone (18.7%, a difference of 0.16%), Eastern European (18.7%, a difference of 0.21%), and Bulgarian (18.8%, a difference of 0.26%).
| Demographics | Rating | Rank | 3 or more Vehicles in Household |
| Russians | 14.2 /100 | #205 | Poor 18.8% |
| Immigrants | Eastern Asia | 14.1 /100 | #206 | Poor 18.8% |
| Immigrants | Chile | 13.6 /100 | #207 | Poor 18.8% |
| Immigrants | Burma/Myanmar | 13.6 /100 | #208 | Poor 18.8% |
| Immigrants | Egypt | 13.5 /100 | #209 | Poor 18.8% |
| Bulgarians | 13.1 /100 | #210 | Poor 18.8% |
| Immigrants | Kenya | 12.4 /100 | #211 | Poor 18.8% |
| Panamanians | 11.6 /100 | #212 | Poor 18.8% |
| Immigrants | Cuba | 11.6 /100 | #213 | Poor 18.8% |
| Immigrants | Sierra Leone | 10.8 /100 | #214 | Poor 18.7% |
| Eastern Europeans | 10.6 /100 | #215 | Poor 18.7% |
| Immigrants | Nigeria | 10.3 /100 | #216 | Poor 18.7% |
| Immigrants | Italy | 10.2 /100 | #217 | Poor 18.7% |
| Immigrants | Portugal | 8.9 /100 | #218 | Tragic 18.6% |
| Immigrants | Armenia | 8.6 /100 | #219 | Tragic 18.6% |