Immigrants from China vs Uruguayan 3 or more Vehicles in Household
COMPARE
Immigrants from China
Uruguayan
3 or more Vehicles in Household
3 or more Vehicles in Household Comparison
Immigrants from China
Uruguayans
18.2%
3 OR MORE VEHICLES IN HOUSEHOLD
2.9/ 100
METRIC RATING
240th/ 347
METRIC RANK
17.8%
3 OR MORE VEHICLES IN HOUSEHOLD
1.0/ 100
METRIC RATING
259th/ 347
METRIC RANK
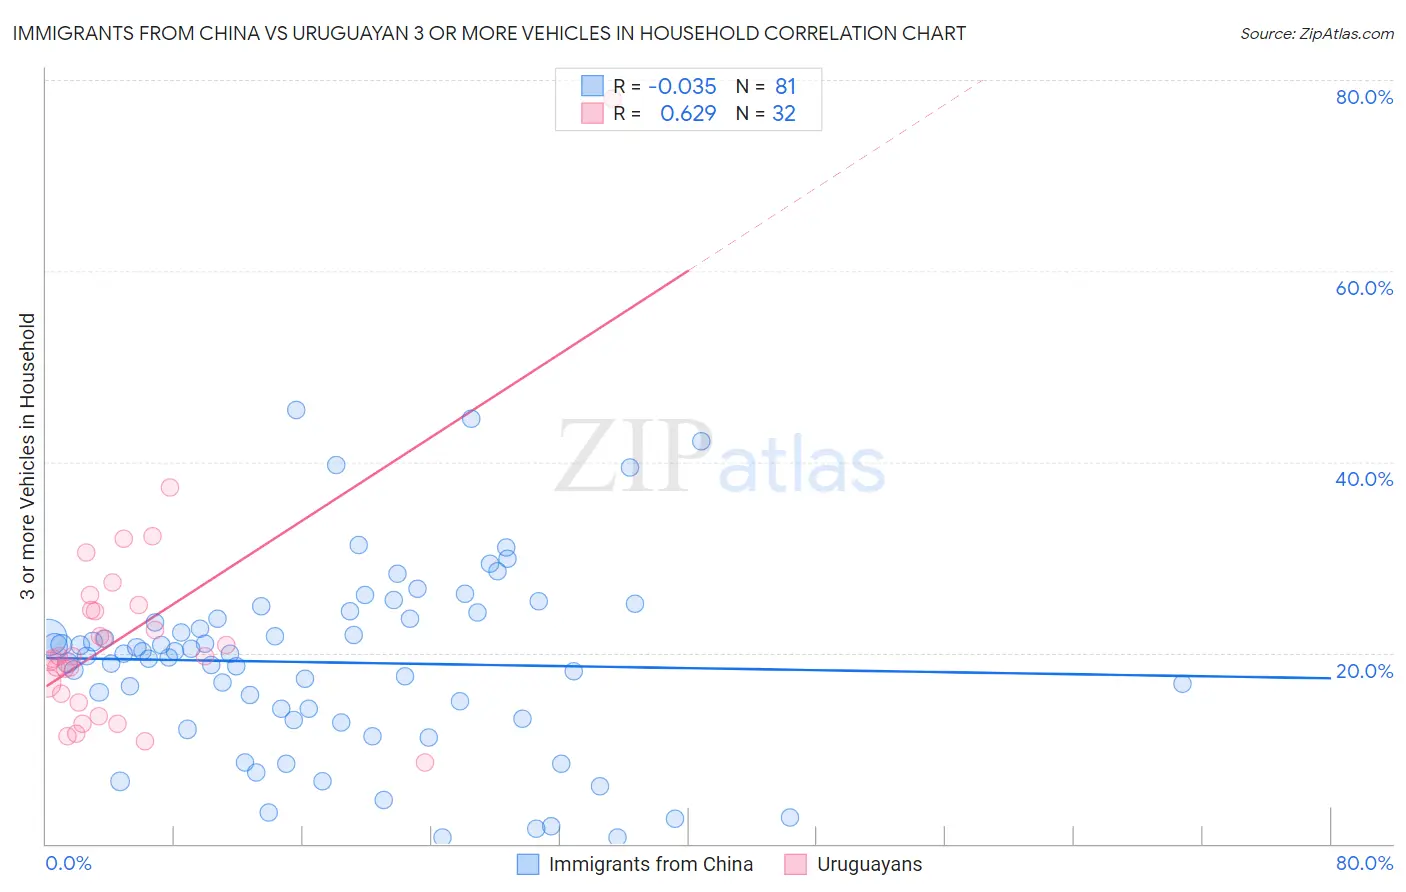
Immigrants from China vs Uruguayan 3 or more Vehicles in Household Correlation Chart
The statistical analysis conducted on geographies consisting of 456,383,621 people shows no correlation between the proportion of Immigrants from China and percentage of households with 3 or more vehicles available in the United States with a correlation coefficient (R) of -0.035 and weighted average of 18.2%. Similarly, the statistical analysis conducted on geographies consisting of 144,743,847 people shows a significant positive correlation between the proportion of Uruguayans and percentage of households with 3 or more vehicles available in the United States with a correlation coefficient (R) of 0.629 and weighted average of 17.8%, a difference of 2.3%.
3 or more Vehicles in Household Correlation Summary
| Measurement | Immigrants from China | Uruguayan |
| Minimum | 0.62% | 8.6% |
| Maximum | 45.4% | 78.0% |
| Range | 44.8% | 69.5% |
| Mean | 19.0% | 22.0% |
| Median | 19.9% | 19.7% |
| Interquartile 25% (IQ1) | 13.0% | 15.3% |
| Interquartile 75% (IQ3) | 23.9% | 24.7% |
| Interquartile Range (IQR) | 10.9% | 9.4% |
| Standard Deviation (Sample) | 9.7% | 12.3% |
| Standard Deviation (Population) | 9.6% | 12.1% |
Demographics Similar to Immigrants from China and Uruguayans by 3 or more Vehicles in Household
In terms of 3 or more vehicles in household, the demographic groups most similar to Immigrants from China are Immigrants from Middle Africa (18.2%, a difference of 0.13%), African (18.2%, a difference of 0.20%), Hopi (18.2%, a difference of 0.31%), Immigrants from Europe (18.1%, a difference of 0.43%), and Mongolian (18.1%, a difference of 0.55%). Similarly, the demographic groups most similar to Uruguayans are Immigrants from Eritrea (17.8%, a difference of 0.22%), Sudanese (17.8%, a difference of 0.22%), Subsaharan African (17.9%, a difference of 0.27%), Immigrants from Turkey (17.9%, a difference of 0.43%), and Immigrants from Ethiopia (17.9%, a difference of 0.46%).
| Demographics | Rating | Rank | 3 or more Vehicles in Household |
| Immigrants | Middle Africa | 3.1 /100 | #239 | Tragic 18.2% |
| Immigrants | China | 2.9 /100 | #240 | Tragic 18.2% |
| Africans | 2.7 /100 | #241 | Tragic 18.2% |
| Hopi | 2.5 /100 | #242 | Tragic 18.2% |
| Immigrants | Europe | 2.4 /100 | #243 | Tragic 18.1% |
| Mongolians | 2.3 /100 | #244 | Tragic 18.1% |
| Immigrants | Belize | 2.1 /100 | #245 | Tragic 18.1% |
| Immigrants | Australia | 2.0 /100 | #246 | Tragic 18.1% |
| Carpatho Rusyns | 1.9 /100 | #247 | Tragic 18.0% |
| Immigrants | Eastern Africa | 1.8 /100 | #248 | Tragic 18.0% |
| Immigrants | Saudi Arabia | 1.7 /100 | #249 | Tragic 18.0% |
| Venezuelans | 1.7 /100 | #250 | Tragic 18.0% |
| Alsatians | 1.5 /100 | #251 | Tragic 18.0% |
| Immigrants | Southern Europe | 1.4 /100 | #252 | Tragic 17.9% |
| Immigrants | Ethiopia | 1.3 /100 | #253 | Tragic 17.9% |
| Ethiopians | 1.2 /100 | #254 | Tragic 17.9% |
| Immigrants | Turkey | 1.2 /100 | #255 | Tragic 17.9% |
| Sub-Saharan Africans | 1.1 /100 | #256 | Tragic 17.9% |
| Immigrants | Eritrea | 1.1 /100 | #257 | Tragic 17.8% |
| Sudanese | 1.1 /100 | #258 | Tragic 17.8% |
| Uruguayans | 1.0 /100 | #259 | Tragic 17.8% |