Immigrants from China vs Black/African American 3 or more Vehicles in Household
COMPARE
Immigrants from China
Black/African American
3 or more Vehicles in Household
3 or more Vehicles in Household Comparison
Immigrants from China
Blacks/African Americans
18.2%
3 OR MORE VEHICLES IN HOUSEHOLD
2.9/ 100
METRIC RATING
240th/ 347
METRIC RANK
17.3%
3 OR MORE VEHICLES IN HOUSEHOLD
0.3/ 100
METRIC RATING
283rd/ 347
METRIC RANK
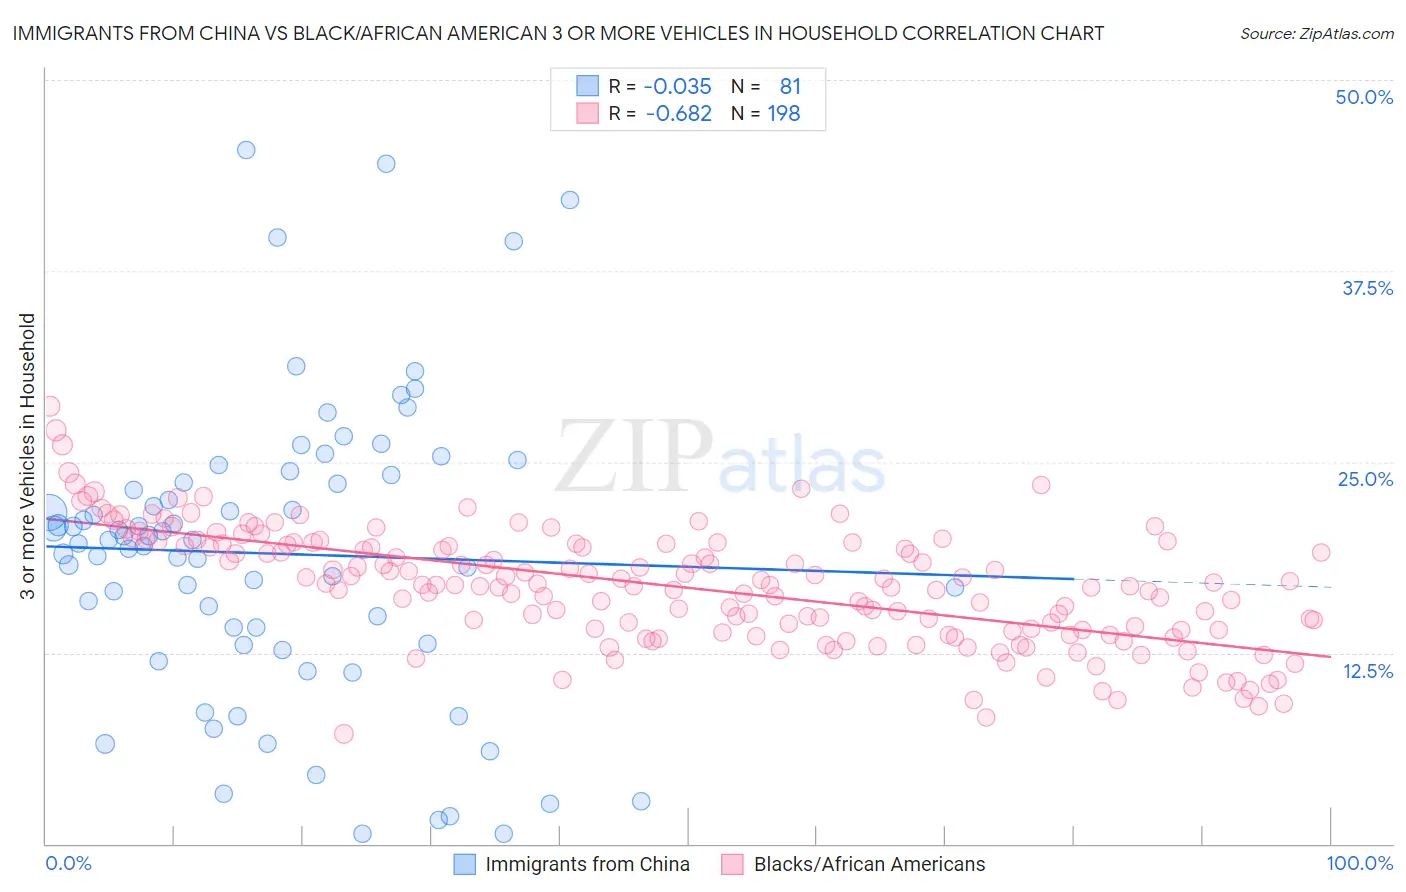
Immigrants from China vs Black/African American 3 or more Vehicles in Household Correlation Chart
The statistical analysis conducted on geographies consisting of 456,383,621 people shows no correlation between the proportion of Immigrants from China and percentage of households with 3 or more vehicles available in the United States with a correlation coefficient (R) of -0.035 and weighted average of 18.2%. Similarly, the statistical analysis conducted on geographies consisting of 564,977,074 people shows a significant negative correlation between the proportion of Blacks/African Americans and percentage of households with 3 or more vehicles available in the United States with a correlation coefficient (R) of -0.682 and weighted average of 17.3%, a difference of 5.1%.
3 or more Vehicles in Household Correlation Summary
| Measurement | Immigrants from China | Black/African American |
| Minimum | 0.62% | 7.2% |
| Maximum | 45.4% | 28.7% |
| Range | 44.8% | 21.4% |
| Mean | 19.0% | 16.8% |
| Median | 19.9% | 16.9% |
| Interquartile 25% (IQ1) | 13.0% | 14.0% |
| Interquartile 75% (IQ3) | 23.9% | 19.6% |
| Interquartile Range (IQR) | 10.9% | 5.6% |
| Standard Deviation (Sample) | 9.7% | 3.8% |
| Standard Deviation (Population) | 9.6% | 3.8% |
Similar Demographics by 3 or more Vehicles in Household
Demographics Similar to Immigrants from China by 3 or more Vehicles in Household
In terms of 3 or more vehicles in household, the demographic groups most similar to Immigrants from China are Immigrants from Honduras (18.2%, a difference of 0.13%), Immigrants from Middle Africa (18.2%, a difference of 0.13%), African (18.2%, a difference of 0.20%), Hopi (18.2%, a difference of 0.31%), and Indonesian (18.3%, a difference of 0.36%).
| Demographics | Rating | Rank | 3 or more Vehicles in Household |
| Hondurans | 4.6 /100 | #233 | Tragic 18.4% |
| Immigrants | North Macedonia | 4.4 /100 | #234 | Tragic 18.4% |
| Sierra Leoneans | 3.9 /100 | #235 | Tragic 18.3% |
| Immigrants | Malaysia | 3.6 /100 | #236 | Tragic 18.3% |
| Indonesians | 3.5 /100 | #237 | Tragic 18.3% |
| Immigrants | Honduras | 3.1 /100 | #238 | Tragic 18.2% |
| Immigrants | Middle Africa | 3.1 /100 | #239 | Tragic 18.2% |
| Immigrants | China | 2.9 /100 | #240 | Tragic 18.2% |
| Africans | 2.7 /100 | #241 | Tragic 18.2% |
| Hopi | 2.5 /100 | #242 | Tragic 18.2% |
| Immigrants | Europe | 2.4 /100 | #243 | Tragic 18.1% |
| Mongolians | 2.3 /100 | #244 | Tragic 18.1% |
| Immigrants | Belize | 2.1 /100 | #245 | Tragic 18.1% |
| Immigrants | Australia | 2.0 /100 | #246 | Tragic 18.1% |
| Carpatho Rusyns | 1.9 /100 | #247 | Tragic 18.0% |
Demographics Similar to Blacks/African Americans by 3 or more Vehicles in Household
In terms of 3 or more vehicles in household, the demographic groups most similar to Blacks/African Americans are Immigrants from Ireland (17.3%, a difference of 0.050%), Immigrants from Colombia (17.3%, a difference of 0.12%), Immigrants from Latvia (17.4%, a difference of 0.34%), Immigrants from Eastern Europe (17.4%, a difference of 0.38%), and Immigrants from Kazakhstan (17.4%, a difference of 0.42%).
| Demographics | Rating | Rank | 3 or more Vehicles in Household |
| Okinawans | 0.4 /100 | #276 | Tragic 17.4% |
| Brazilians | 0.4 /100 | #277 | Tragic 17.4% |
| Immigrants | Bahamas | 0.3 /100 | #278 | Tragic 17.4% |
| Immigrants | Kazakhstan | 0.3 /100 | #279 | Tragic 17.4% |
| Immigrants | Eastern Europe | 0.3 /100 | #280 | Tragic 17.4% |
| Immigrants | Latvia | 0.3 /100 | #281 | Tragic 17.4% |
| Immigrants | Ireland | 0.3 /100 | #282 | Tragic 17.3% |
| Blacks/African Americans | 0.3 /100 | #283 | Tragic 17.3% |
| Immigrants | Colombia | 0.3 /100 | #284 | Tragic 17.3% |
| Immigrants | Croatia | 0.2 /100 | #285 | Tragic 17.2% |
| Menominee | 0.2 /100 | #286 | Tragic 17.2% |
| Immigrants | Brazil | 0.2 /100 | #287 | Tragic 17.1% |
| Immigrants | Uruguay | 0.2 /100 | #288 | Tragic 17.1% |
| Immigrants | Liberia | 0.1 /100 | #289 | Tragic 17.1% |
| Liberians | 0.1 /100 | #290 | Tragic 17.0% |