Immigrants from China vs Iraqi 3 or more Vehicles in Household
COMPARE
Immigrants from China
Iraqi
3 or more Vehicles in Household
3 or more Vehicles in Household Comparison
Immigrants from China
Iraqis
18.2%
3 OR MORE VEHICLES IN HOUSEHOLD
2.9/ 100
METRIC RATING
240th/ 347
METRIC RANK
19.6%
3 OR MORE VEHICLES IN HOUSEHOLD
56.0/ 100
METRIC RATING
170th/ 347
METRIC RANK
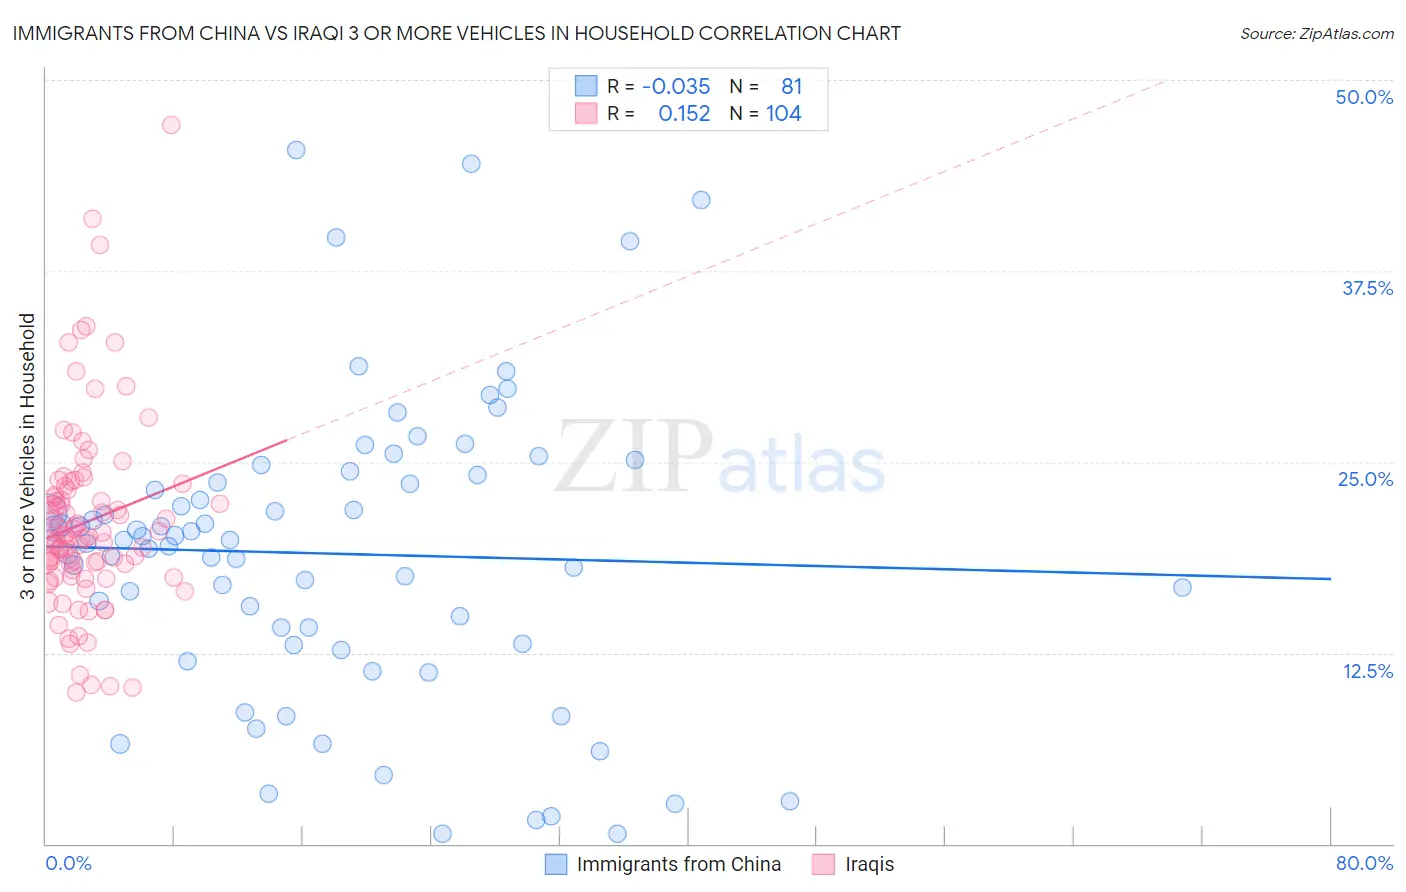
Immigrants from China vs Iraqi 3 or more Vehicles in Household Correlation Chart
The statistical analysis conducted on geographies consisting of 456,383,621 people shows no correlation between the proportion of Immigrants from China and percentage of households with 3 or more vehicles available in the United States with a correlation coefficient (R) of -0.035 and weighted average of 18.2%. Similarly, the statistical analysis conducted on geographies consisting of 170,599,174 people shows a poor positive correlation between the proportion of Iraqis and percentage of households with 3 or more vehicles available in the United States with a correlation coefficient (R) of 0.152 and weighted average of 19.6%, a difference of 7.6%.
3 or more Vehicles in Household Correlation Summary
| Measurement | Immigrants from China | Iraqi |
| Minimum | 0.62% | 9.9% |
| Maximum | 45.4% | 47.1% |
| Range | 44.8% | 37.2% |
| Mean | 19.0% | 21.0% |
| Median | 19.9% | 20.1% |
| Interquartile 25% (IQ1) | 13.0% | 18.1% |
| Interquartile 75% (IQ3) | 23.9% | 23.0% |
| Interquartile Range (IQR) | 10.9% | 4.9% |
| Standard Deviation (Sample) | 9.7% | 6.1% |
| Standard Deviation (Population) | 9.6% | 6.1% |
Similar Demographics by 3 or more Vehicles in Household
Demographics Similar to Immigrants from China by 3 or more Vehicles in Household
In terms of 3 or more vehicles in household, the demographic groups most similar to Immigrants from China are Immigrants from Honduras (18.2%, a difference of 0.13%), Immigrants from Middle Africa (18.2%, a difference of 0.13%), African (18.2%, a difference of 0.20%), Hopi (18.2%, a difference of 0.31%), and Indonesian (18.3%, a difference of 0.36%).
| Demographics | Rating | Rank | 3 or more Vehicles in Household |
| Hondurans | 4.6 /100 | #233 | Tragic 18.4% |
| Immigrants | North Macedonia | 4.4 /100 | #234 | Tragic 18.4% |
| Sierra Leoneans | 3.9 /100 | #235 | Tragic 18.3% |
| Immigrants | Malaysia | 3.6 /100 | #236 | Tragic 18.3% |
| Indonesians | 3.5 /100 | #237 | Tragic 18.3% |
| Immigrants | Honduras | 3.1 /100 | #238 | Tragic 18.2% |
| Immigrants | Middle Africa | 3.1 /100 | #239 | Tragic 18.2% |
| Immigrants | China | 2.9 /100 | #240 | Tragic 18.2% |
| Africans | 2.7 /100 | #241 | Tragic 18.2% |
| Hopi | 2.5 /100 | #242 | Tragic 18.2% |
| Immigrants | Europe | 2.4 /100 | #243 | Tragic 18.1% |
| Mongolians | 2.3 /100 | #244 | Tragic 18.1% |
| Immigrants | Belize | 2.1 /100 | #245 | Tragic 18.1% |
| Immigrants | Australia | 2.0 /100 | #246 | Tragic 18.1% |
| Carpatho Rusyns | 1.9 /100 | #247 | Tragic 18.0% |
Demographics Similar to Iraqis by 3 or more Vehicles in Household
In terms of 3 or more vehicles in household, the demographic groups most similar to Iraqis are Immigrants from Denmark (19.6%, a difference of 0.13%), Peruvian (19.6%, a difference of 0.21%), Immigrants from Western Europe (19.5%, a difference of 0.21%), Ukrainian (19.6%, a difference of 0.22%), and Immigrants from Cameroon (19.7%, a difference of 0.38%).
| Demographics | Rating | Rank | 3 or more Vehicles in Household |
| Chileans | 63.0 /100 | #163 | Good 19.7% |
| Yugoslavians | 62.9 /100 | #164 | Good 19.7% |
| Immigrants | Costa Rica | 61.9 /100 | #165 | Good 19.7% |
| Immigrants | Cameroon | 60.9 /100 | #166 | Good 19.7% |
| Ukrainians | 58.9 /100 | #167 | Average 19.6% |
| Peruvians | 58.8 /100 | #168 | Average 19.6% |
| Immigrants | Denmark | 57.6 /100 | #169 | Average 19.6% |
| Iraqis | 56.0 /100 | #170 | Average 19.6% |
| Immigrants | Western Europe | 53.2 /100 | #171 | Average 19.5% |
| Kiowa | 50.9 /100 | #172 | Average 19.5% |
| Immigrants | Northern Europe | 50.2 /100 | #173 | Average 19.5% |
| Immigrants | South Africa | 50.0 /100 | #174 | Average 19.5% |
| Syrians | 47.0 /100 | #175 | Average 19.5% |
| Iroquois | 46.0 /100 | #176 | Average 19.4% |
| Immigrants | Peru | 41.1 /100 | #177 | Average 19.4% |