Immigrants from China vs Panamanian Family Poverty
COMPARE
Immigrants from China
Panamanian
Family Poverty
Family Poverty Comparison
Immigrants from China
Panamanians
7.8%
FAMILY POVERTY
98.1/ 100
METRIC RATING
74th/ 347
METRIC RANK
9.8%
FAMILY POVERTY
5.6/ 100
METRIC RATING
218th/ 347
METRIC RANK
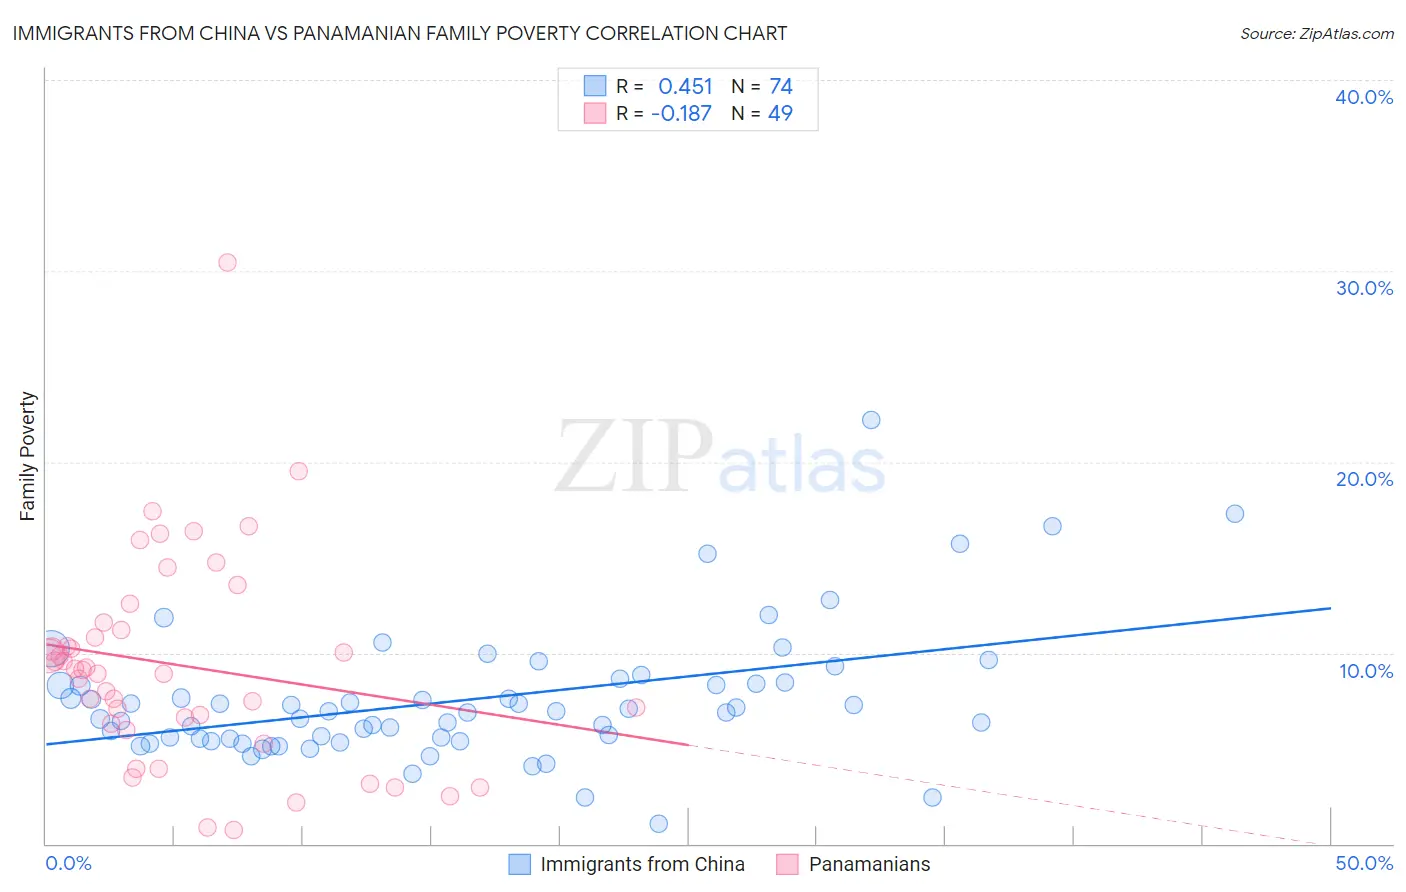
Immigrants from China vs Panamanian Family Poverty Correlation Chart
The statistical analysis conducted on geographies consisting of 454,907,220 people shows a moderate positive correlation between the proportion of Immigrants from China and poverty level among families in the United States with a correlation coefficient (R) of 0.451 and weighted average of 7.8%. Similarly, the statistical analysis conducted on geographies consisting of 280,803,114 people shows a poor negative correlation between the proportion of Panamanians and poverty level among families in the United States with a correlation coefficient (R) of -0.187 and weighted average of 9.8%, a difference of 25.6%.
Family Poverty Correlation Summary
| Measurement | Immigrants from China | Panamanian |
| Minimum | 1.0% | 0.72% |
| Maximum | 22.2% | 30.4% |
| Range | 21.2% | 29.7% |
| Mean | 7.5% | 9.3% |
| Median | 6.9% | 9.1% |
| Interquartile 25% (IQ1) | 5.5% | 6.1% |
| Interquartile 75% (IQ3) | 8.4% | 11.4% |
| Interquartile Range (IQR) | 2.9% | 5.3% |
| Standard Deviation (Sample) | 3.5% | 5.5% |
| Standard Deviation (Population) | 3.4% | 5.4% |
Similar Demographics by Family Poverty
Demographics Similar to Immigrants from China by Family Poverty
In terms of family poverty, the demographic groups most similar to Immigrants from China are Austrian (7.8%, a difference of 0.070%), Immigrants from Romania (7.8%, a difference of 0.080%), Cambodian (7.8%, a difference of 0.14%), Immigrants from Croatia (7.8%, a difference of 0.14%), and Immigrants from Canada (7.8%, a difference of 0.16%).
| Demographics | Rating | Rank | Family Poverty |
| Northern Europeans | 98.3 /100 | #67 | Exceptional 7.8% |
| Australians | 98.2 /100 | #68 | Exceptional 7.8% |
| Immigrants | Belgium | 98.2 /100 | #69 | Exceptional 7.8% |
| Immigrants | Canada | 98.2 /100 | #70 | Exceptional 7.8% |
| Cambodians | 98.2 /100 | #71 | Exceptional 7.8% |
| Immigrants | Romania | 98.2 /100 | #72 | Exceptional 7.8% |
| Austrians | 98.2 /100 | #73 | Exceptional 7.8% |
| Immigrants | China | 98.1 /100 | #74 | Exceptional 7.8% |
| Immigrants | Croatia | 98.1 /100 | #75 | Exceptional 7.8% |
| Immigrants | Latvia | 98.0 /100 | #76 | Exceptional 7.9% |
| Ukrainians | 98.0 /100 | #77 | Exceptional 7.9% |
| Immigrants | North America | 97.9 /100 | #78 | Exceptional 7.9% |
| Immigrants | Europe | 97.8 /100 | #79 | Exceptional 7.9% |
| English | 97.8 /100 | #80 | Exceptional 7.9% |
| Irish | 97.8 /100 | #81 | Exceptional 7.9% |
Demographics Similar to Panamanians by Family Poverty
In terms of family poverty, the demographic groups most similar to Panamanians are Immigrants from Eritrea (9.9%, a difference of 0.13%), Bermudan (9.9%, a difference of 0.18%), American (9.8%, a difference of 0.32%), Immigrants from Cambodia (9.9%, a difference of 0.46%), and Japanese (9.9%, a difference of 0.49%).
| Demographics | Rating | Rank | Family Poverty |
| Malaysians | 10.6 /100 | #211 | Poor 9.6% |
| Immigrants | Thailand | 9.7 /100 | #212 | Tragic 9.7% |
| Osage | 8.0 /100 | #213 | Tragic 9.7% |
| Immigrants | Micronesia | 6.7 /100 | #214 | Tragic 9.8% |
| Immigrants | Nonimmigrants | 6.7 /100 | #215 | Tragic 9.8% |
| Moroccans | 6.5 /100 | #216 | Tragic 9.8% |
| Americans | 6.2 /100 | #217 | Tragic 9.8% |
| Panamanians | 5.6 /100 | #218 | Tragic 9.8% |
| Immigrants | Eritrea | 5.4 /100 | #219 | Tragic 9.9% |
| Bermudans | 5.3 /100 | #220 | Tragic 9.9% |
| Immigrants | Cambodia | 4.8 /100 | #221 | Tragic 9.9% |
| Japanese | 4.8 /100 | #222 | Tragic 9.9% |
| Immigrants | Africa | 4.3 /100 | #223 | Tragic 9.9% |
| Marshallese | 3.9 /100 | #224 | Tragic 9.9% |
| Immigrants | Immigrants | 3.6 /100 | #225 | Tragic 10.0% |