Immigrants from China vs African 3 or more Vehicles in Household
COMPARE
Immigrants from China
African
3 or more Vehicles in Household
3 or more Vehicles in Household Comparison
Immigrants from China
Africans
18.2%
3 OR MORE VEHICLES IN HOUSEHOLD
2.9/ 100
METRIC RATING
240th/ 347
METRIC RANK
18.2%
3 OR MORE VEHICLES IN HOUSEHOLD
2.7/ 100
METRIC RATING
241st/ 347
METRIC RANK
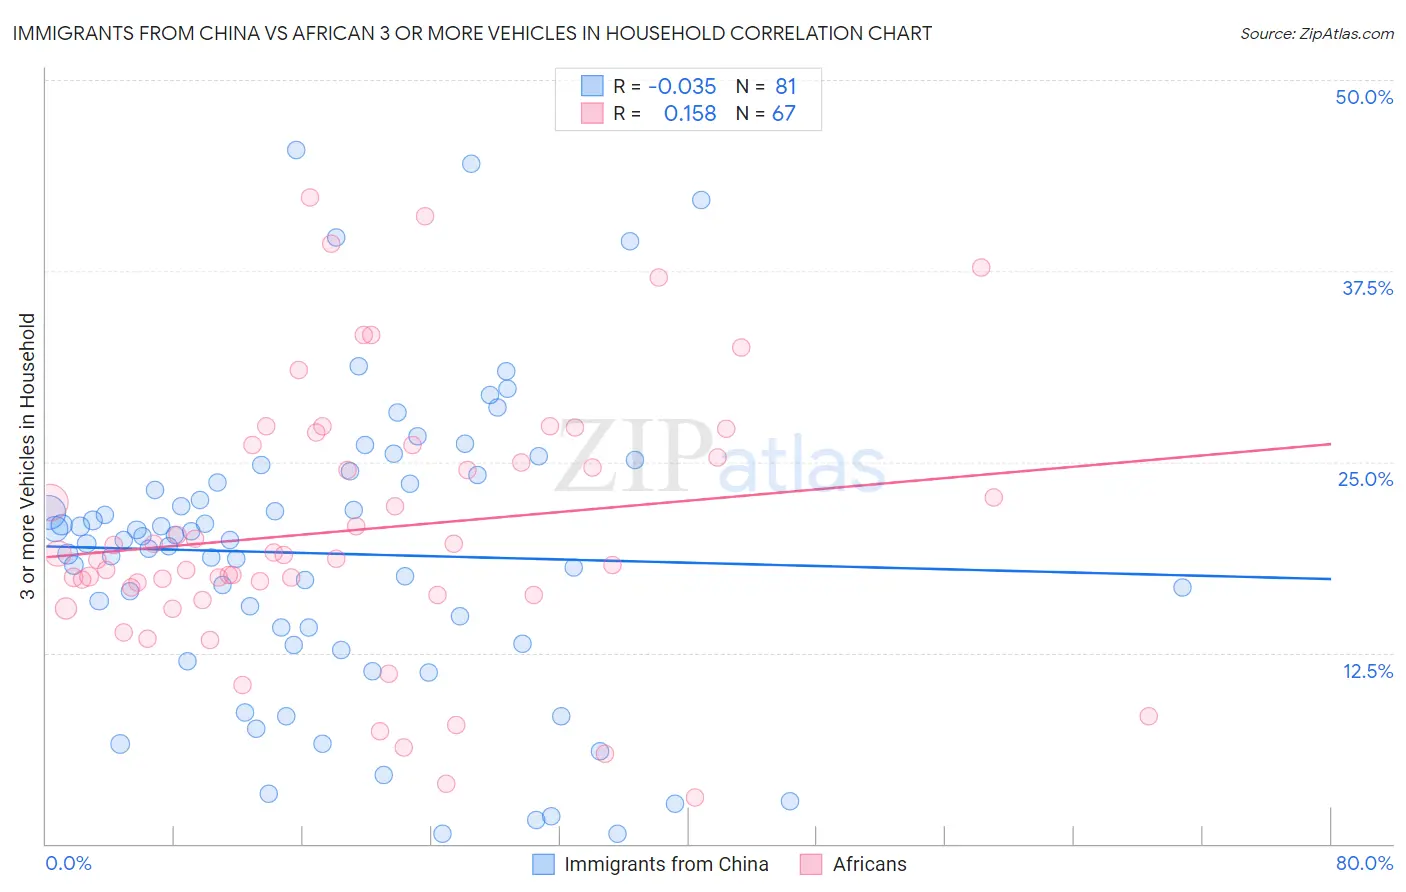
Immigrants from China vs African 3 or more Vehicles in Household Correlation Chart
The statistical analysis conducted on geographies consisting of 456,383,621 people shows no correlation between the proportion of Immigrants from China and percentage of households with 3 or more vehicles available in the United States with a correlation coefficient (R) of -0.035 and weighted average of 18.2%. Similarly, the statistical analysis conducted on geographies consisting of 469,466,855 people shows a poor positive correlation between the proportion of Africans and percentage of households with 3 or more vehicles available in the United States with a correlation coefficient (R) of 0.158 and weighted average of 18.2%, a difference of 0.20%.
3 or more Vehicles in Household Correlation Summary
| Measurement | Immigrants from China | African |
| Minimum | 0.62% | 3.0% |
| Maximum | 45.4% | 42.3% |
| Range | 44.8% | 39.3% |
| Mean | 19.0% | 20.6% |
| Median | 19.9% | 18.9% |
| Interquartile 25% (IQ1) | 13.0% | 16.3% |
| Interquartile 75% (IQ3) | 23.9% | 26.1% |
| Interquartile Range (IQR) | 10.9% | 9.8% |
| Standard Deviation (Sample) | 9.7% | 8.6% |
| Standard Deviation (Population) | 9.6% | 8.6% |
Demographics Similar to Immigrants from China and Africans by 3 or more Vehicles in Household
In terms of 3 or more vehicles in household, the demographic groups most similar to Immigrants from China are Immigrants from Honduras (18.2%, a difference of 0.13%), Immigrants from Middle Africa (18.2%, a difference of 0.13%), Hopi (18.2%, a difference of 0.31%), Indonesian (18.3%, a difference of 0.36%), and Immigrants from Malaysia (18.3%, a difference of 0.41%). Similarly, the demographic groups most similar to Africans are Hopi (18.2%, a difference of 0.11%), Immigrants from Europe (18.1%, a difference of 0.23%), Immigrants from Middle Africa (18.2%, a difference of 0.32%), Immigrants from Honduras (18.2%, a difference of 0.33%), and Mongolian (18.1%, a difference of 0.35%).
| Demographics | Rating | Rank | 3 or more Vehicles in Household |
| Immigrants | Western Asia | 4.8 /100 | #230 | Tragic 18.4% |
| Immigrants | Belgium | 4.8 /100 | #231 | Tragic 18.4% |
| Immigrants | Uganda | 4.6 /100 | #232 | Tragic 18.4% |
| Hondurans | 4.6 /100 | #233 | Tragic 18.4% |
| Immigrants | North Macedonia | 4.4 /100 | #234 | Tragic 18.4% |
| Sierra Leoneans | 3.9 /100 | #235 | Tragic 18.3% |
| Immigrants | Malaysia | 3.6 /100 | #236 | Tragic 18.3% |
| Indonesians | 3.5 /100 | #237 | Tragic 18.3% |
| Immigrants | Honduras | 3.1 /100 | #238 | Tragic 18.2% |
| Immigrants | Middle Africa | 3.1 /100 | #239 | Tragic 18.2% |
| Immigrants | China | 2.9 /100 | #240 | Tragic 18.2% |
| Africans | 2.7 /100 | #241 | Tragic 18.2% |
| Hopi | 2.5 /100 | #242 | Tragic 18.2% |
| Immigrants | Europe | 2.4 /100 | #243 | Tragic 18.1% |
| Mongolians | 2.3 /100 | #244 | Tragic 18.1% |
| Immigrants | Belize | 2.1 /100 | #245 | Tragic 18.1% |
| Immigrants | Australia | 2.0 /100 | #246 | Tragic 18.1% |
| Carpatho Rusyns | 1.9 /100 | #247 | Tragic 18.0% |
| Immigrants | Eastern Africa | 1.8 /100 | #248 | Tragic 18.0% |
| Immigrants | Saudi Arabia | 1.7 /100 | #249 | Tragic 18.0% |
| Venezuelans | 1.7 /100 | #250 | Tragic 18.0% |