Immigrants from China vs Immigrants from Nicaragua 3 or more Vehicles in Household
COMPARE
Immigrants from China
Immigrants from Nicaragua
3 or more Vehicles in Household
3 or more Vehicles in Household Comparison
Immigrants from China
Immigrants from Nicaragua
18.2%
3 OR MORE VEHICLES IN HOUSEHOLD
2.9/ 100
METRIC RATING
240th/ 347
METRIC RANK
20.2%
3 OR MORE VEHICLES IN HOUSEHOLD
87.1/ 100
METRIC RATING
136th/ 347
METRIC RANK
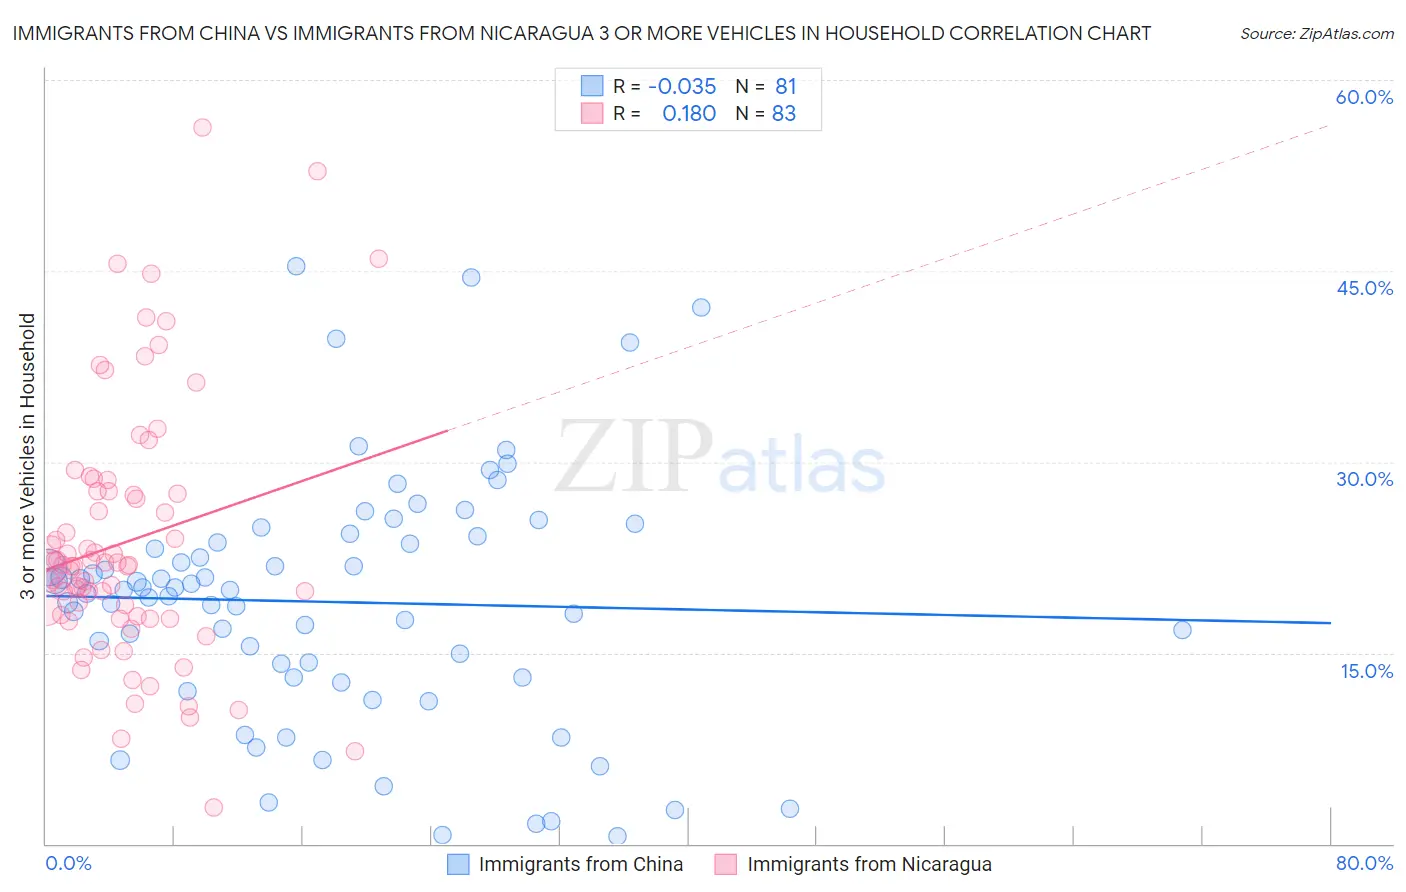
Immigrants from China vs Immigrants from Nicaragua 3 or more Vehicles in Household Correlation Chart
The statistical analysis conducted on geographies consisting of 456,383,621 people shows no correlation between the proportion of Immigrants from China and percentage of households with 3 or more vehicles available in the United States with a correlation coefficient (R) of -0.035 and weighted average of 18.2%. Similarly, the statistical analysis conducted on geographies consisting of 236,311,792 people shows a poor positive correlation between the proportion of Immigrants from Nicaragua and percentage of households with 3 or more vehicles available in the United States with a correlation coefficient (R) of 0.180 and weighted average of 20.2%, a difference of 10.9%.
3 or more Vehicles in Household Correlation Summary
| Measurement | Immigrants from China | Immigrants from Nicaragua |
| Minimum | 0.62% | 2.8% |
| Maximum | 45.4% | 56.2% |
| Range | 44.8% | 53.4% |
| Mean | 19.0% | 23.7% |
| Median | 19.9% | 21.9% |
| Interquartile 25% (IQ1) | 13.0% | 17.9% |
| Interquartile 75% (IQ3) | 23.9% | 27.6% |
| Interquartile Range (IQR) | 10.9% | 9.8% |
| Standard Deviation (Sample) | 9.7% | 10.0% |
| Standard Deviation (Population) | 9.6% | 9.9% |
Similar Demographics by 3 or more Vehicles in Household
Demographics Similar to Immigrants from China by 3 or more Vehicles in Household
In terms of 3 or more vehicles in household, the demographic groups most similar to Immigrants from China are Immigrants from Honduras (18.2%, a difference of 0.13%), Immigrants from Middle Africa (18.2%, a difference of 0.13%), African (18.2%, a difference of 0.20%), Hopi (18.2%, a difference of 0.31%), and Indonesian (18.3%, a difference of 0.36%).
| Demographics | Rating | Rank | 3 or more Vehicles in Household |
| Hondurans | 4.6 /100 | #233 | Tragic 18.4% |
| Immigrants | North Macedonia | 4.4 /100 | #234 | Tragic 18.4% |
| Sierra Leoneans | 3.9 /100 | #235 | Tragic 18.3% |
| Immigrants | Malaysia | 3.6 /100 | #236 | Tragic 18.3% |
| Indonesians | 3.5 /100 | #237 | Tragic 18.3% |
| Immigrants | Honduras | 3.1 /100 | #238 | Tragic 18.2% |
| Immigrants | Middle Africa | 3.1 /100 | #239 | Tragic 18.2% |
| Immigrants | China | 2.9 /100 | #240 | Tragic 18.2% |
| Africans | 2.7 /100 | #241 | Tragic 18.2% |
| Hopi | 2.5 /100 | #242 | Tragic 18.2% |
| Immigrants | Europe | 2.4 /100 | #243 | Tragic 18.1% |
| Mongolians | 2.3 /100 | #244 | Tragic 18.1% |
| Immigrants | Belize | 2.1 /100 | #245 | Tragic 18.1% |
| Immigrants | Australia | 2.0 /100 | #246 | Tragic 18.1% |
| Carpatho Rusyns | 1.9 /100 | #247 | Tragic 18.0% |
Demographics Similar to Immigrants from Nicaragua by 3 or more Vehicles in Household
In terms of 3 or more vehicles in household, the demographic groups most similar to Immigrants from Nicaragua are Immigrants from Iraq (20.2%, a difference of 0.0%), Immigrants from India (20.2%, a difference of 0.010%), Polish (20.2%, a difference of 0.030%), Immigrants from Canada (20.2%, a difference of 0.12%), and Immigrants from North America (20.2%, a difference of 0.12%).
| Demographics | Rating | Rank | 3 or more Vehicles in Household |
| Zimbabweans | 88.7 /100 | #129 | Excellent 20.3% |
| Greeks | 88.6 /100 | #130 | Excellent 20.3% |
| Immigrants | Asia | 88.1 /100 | #131 | Excellent 20.2% |
| Immigrants | Canada | 87.8 /100 | #132 | Excellent 20.2% |
| Immigrants | North America | 87.8 /100 | #133 | Excellent 20.2% |
| Poles | 87.3 /100 | #134 | Excellent 20.2% |
| Immigrants | India | 87.2 /100 | #135 | Excellent 20.2% |
| Immigrants | Nicaragua | 87.1 /100 | #136 | Excellent 20.2% |
| Immigrants | Iraq | 87.1 /100 | #137 | Excellent 20.2% |
| Aleuts | 86.3 /100 | #138 | Excellent 20.2% |
| Slovenes | 85.5 /100 | #139 | Excellent 20.2% |
| French American Indians | 85.3 /100 | #140 | Excellent 20.1% |
| Ottawa | 84.9 /100 | #141 | Excellent 20.1% |
| Jordanians | 84.4 /100 | #142 | Excellent 20.1% |
| Lithuanians | 84.4 /100 | #143 | Excellent 20.1% |