Immigrants from Bulgaria vs Iraqi 3 or more Vehicles in Household
COMPARE
Immigrants from Bulgaria
Iraqi
3 or more Vehicles in Household
3 or more Vehicles in Household Comparison
Immigrants from Bulgaria
Iraqis
17.7%
3 OR MORE VEHICLES IN HOUSEHOLD
0.8/ 100
METRIC RATING
268th/ 347
METRIC RANK
19.6%
3 OR MORE VEHICLES IN HOUSEHOLD
56.0/ 100
METRIC RATING
170th/ 347
METRIC RANK
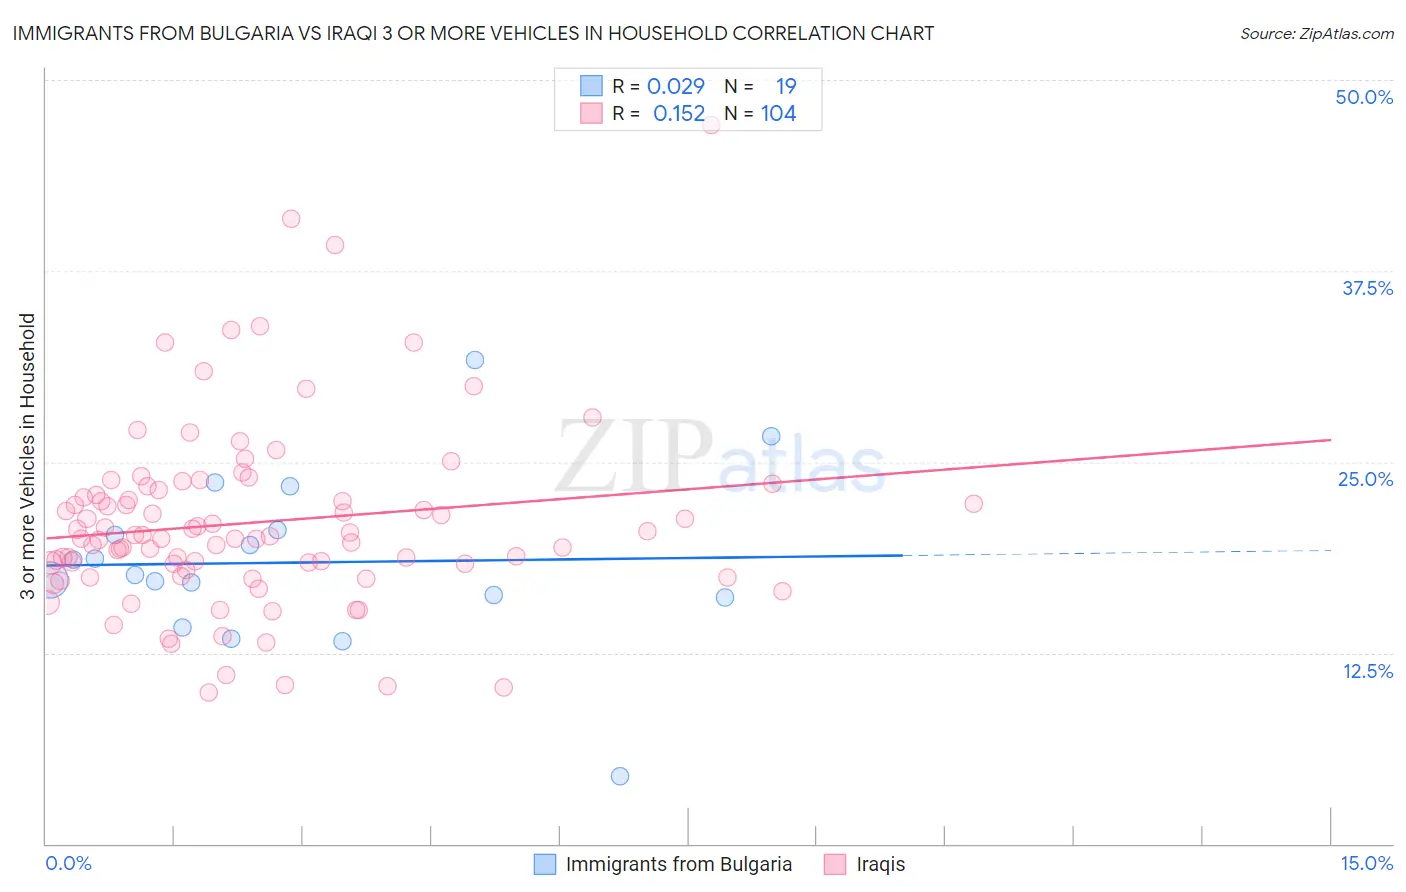
Immigrants from Bulgaria vs Iraqi 3 or more Vehicles in Household Correlation Chart
The statistical analysis conducted on geographies consisting of 172,519,366 people shows no correlation between the proportion of Immigrants from Bulgaria and percentage of households with 3 or more vehicles available in the United States with a correlation coefficient (R) of 0.029 and weighted average of 17.7%. Similarly, the statistical analysis conducted on geographies consisting of 170,599,174 people shows a poor positive correlation between the proportion of Iraqis and percentage of households with 3 or more vehicles available in the United States with a correlation coefficient (R) of 0.152 and weighted average of 19.6%, a difference of 10.6%.
3 or more Vehicles in Household Correlation Summary
| Measurement | Immigrants from Bulgaria | Iraqi |
| Minimum | 4.4% | 9.9% |
| Maximum | 31.6% | 47.1% |
| Range | 27.3% | 37.2% |
| Mean | 18.4% | 21.0% |
| Median | 17.6% | 20.1% |
| Interquartile 25% (IQ1) | 16.1% | 18.1% |
| Interquartile 75% (IQ3) | 20.5% | 23.0% |
| Interquartile Range (IQR) | 4.4% | 4.9% |
| Standard Deviation (Sample) | 5.7% | 6.1% |
| Standard Deviation (Population) | 5.5% | 6.1% |
Similar Demographics by 3 or more Vehicles in Household
Demographics Similar to Immigrants from Bulgaria by 3 or more Vehicles in Household
In terms of 3 or more vehicles in household, the demographic groups most similar to Immigrants from Bulgaria are Immigrants from Venezuela (17.7%, a difference of 0.010%), Macedonian (17.7%, a difference of 0.070%), Immigrants from Panama (17.7%, a difference of 0.090%), Cambodian (17.8%, a difference of 0.23%), and Bermudan (17.8%, a difference of 0.26%).
| Demographics | Rating | Rank | 3 or more Vehicles in Household |
| Immigrants | Northern Africa | 0.9 /100 | #261 | Tragic 17.8% |
| Colombians | 0.9 /100 | #262 | Tragic 17.8% |
| Bermudans | 0.9 /100 | #263 | Tragic 17.8% |
| Cambodians | 0.9 /100 | #264 | Tragic 17.8% |
| Immigrants | Panama | 0.8 /100 | #265 | Tragic 17.7% |
| Macedonians | 0.8 /100 | #266 | Tragic 17.7% |
| Immigrants | Venezuela | 0.8 /100 | #267 | Tragic 17.7% |
| Immigrants | Bulgaria | 0.8 /100 | #268 | Tragic 17.7% |
| Immigrants | France | 0.6 /100 | #269 | Tragic 17.6% |
| Immigrants | Nepal | 0.6 /100 | #270 | Tragic 17.6% |
| South Americans | 0.6 /100 | #271 | Tragic 17.6% |
| Immigrants | Africa | 0.5 /100 | #272 | Tragic 17.6% |
| Immigrants | Sudan | 0.5 /100 | #273 | Tragic 17.6% |
| Immigrants | Bosnia and Herzegovina | 0.5 /100 | #274 | Tragic 17.5% |
| Immigrants | Ukraine | 0.4 /100 | #275 | Tragic 17.5% |
Demographics Similar to Iraqis by 3 or more Vehicles in Household
In terms of 3 or more vehicles in household, the demographic groups most similar to Iraqis are Immigrants from Denmark (19.6%, a difference of 0.13%), Peruvian (19.6%, a difference of 0.21%), Immigrants from Western Europe (19.5%, a difference of 0.21%), Ukrainian (19.6%, a difference of 0.22%), and Immigrants from Cameroon (19.7%, a difference of 0.38%).
| Demographics | Rating | Rank | 3 or more Vehicles in Household |
| Chileans | 63.0 /100 | #163 | Good 19.7% |
| Yugoslavians | 62.9 /100 | #164 | Good 19.7% |
| Immigrants | Costa Rica | 61.9 /100 | #165 | Good 19.7% |
| Immigrants | Cameroon | 60.9 /100 | #166 | Good 19.7% |
| Ukrainians | 58.9 /100 | #167 | Average 19.6% |
| Peruvians | 58.8 /100 | #168 | Average 19.6% |
| Immigrants | Denmark | 57.6 /100 | #169 | Average 19.6% |
| Iraqis | 56.0 /100 | #170 | Average 19.6% |
| Immigrants | Western Europe | 53.2 /100 | #171 | Average 19.5% |
| Kiowa | 50.9 /100 | #172 | Average 19.5% |
| Immigrants | Northern Europe | 50.2 /100 | #173 | Average 19.5% |
| Immigrants | South Africa | 50.0 /100 | #174 | Average 19.5% |
| Syrians | 47.0 /100 | #175 | Average 19.5% |
| Iroquois | 46.0 /100 | #176 | Average 19.4% |
| Immigrants | Peru | 41.1 /100 | #177 | Average 19.4% |