Immigrants from Burma/Myanmar vs Zimbabwean No Vehicles in Household
COMPARE
Immigrants from Burma/Myanmar
Zimbabwean
No Vehicles in Household
No Vehicles in Household Comparison
Immigrants from Burma/Myanmar
Zimbabweans
10.4%
NO VEHICLES IN HOUSEHOLD
49.1/ 100
METRIC RATING
175th/ 347
METRIC RANK
9.0%
NO VEHICLES IN HOUSEHOLD
98.0/ 100
METRIC RATING
104th/ 347
METRIC RANK
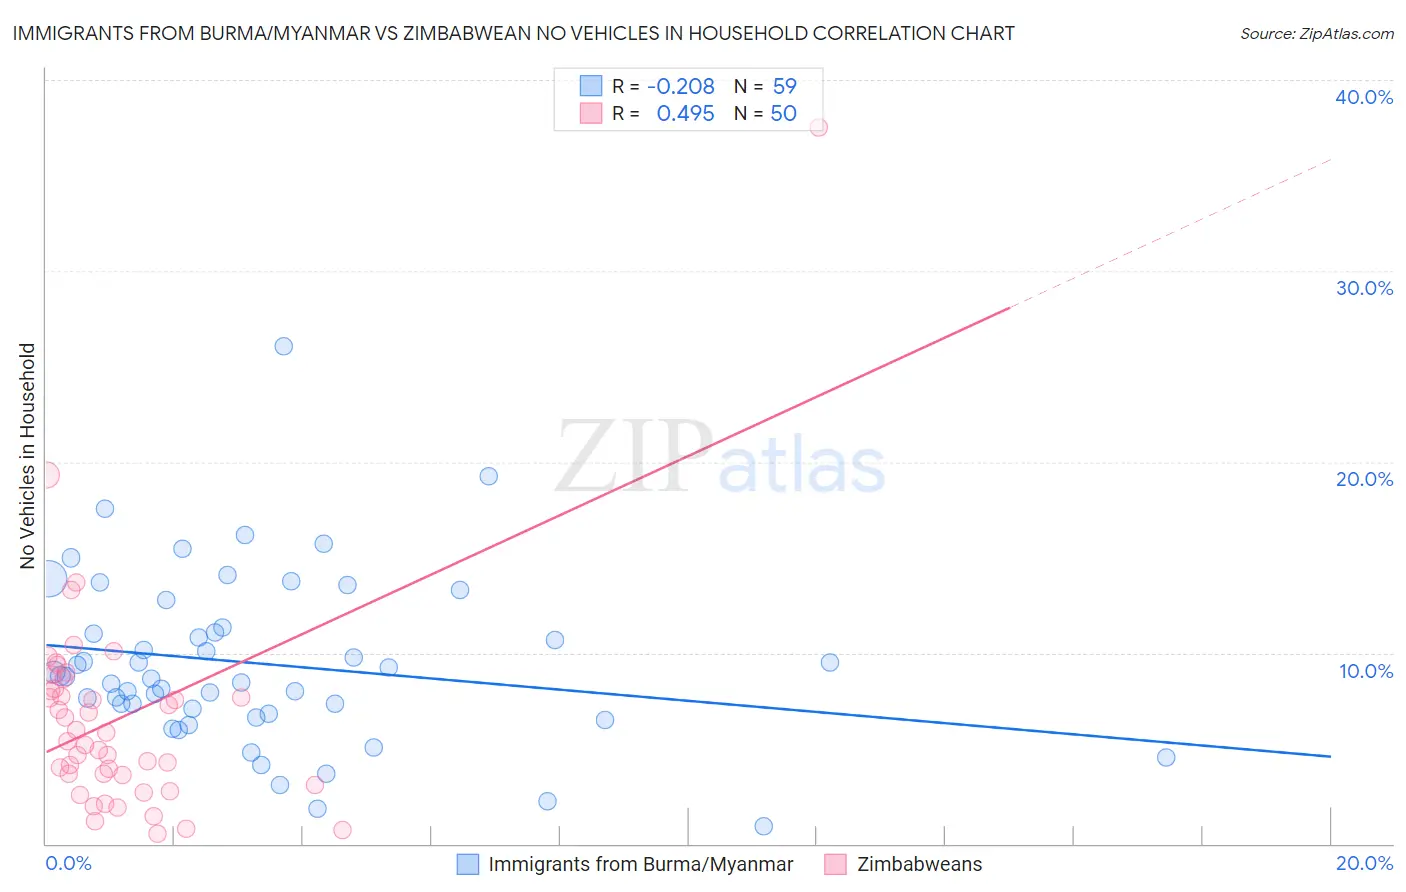
Immigrants from Burma/Myanmar vs Zimbabwean No Vehicles in Household Correlation Chart
The statistical analysis conducted on geographies consisting of 172,182,112 people shows a weak negative correlation between the proportion of Immigrants from Burma/Myanmar and percentage of households with no vehicle available in the United States with a correlation coefficient (R) of -0.208 and weighted average of 10.4%. Similarly, the statistical analysis conducted on geographies consisting of 69,183,978 people shows a moderate positive correlation between the proportion of Zimbabweans and percentage of households with no vehicle available in the United States with a correlation coefficient (R) of 0.495 and weighted average of 9.0%, a difference of 15.2%.
No Vehicles in Household Correlation Summary
| Measurement | Immigrants from Burma/Myanmar | Zimbabwean |
| Minimum | 0.91% | 0.49% |
| Maximum | 26.1% | 37.5% |
| Range | 25.1% | 37.0% |
| Mean | 9.4% | 6.6% |
| Median | 8.8% | 5.6% |
| Interquartile 25% (IQ1) | 6.8% | 3.6% |
| Interquartile 75% (IQ3) | 11.3% | 8.1% |
| Interquartile Range (IQR) | 4.6% | 4.5% |
| Standard Deviation (Sample) | 4.5% | 5.8% |
| Standard Deviation (Population) | 4.5% | 5.7% |
Similar Demographics by No Vehicles in Household
Demographics Similar to Immigrants from Burma/Myanmar by No Vehicles in Household
In terms of no vehicles in household, the demographic groups most similar to Immigrants from Burma/Myanmar are French American Indian (10.4%, a difference of 0.0%), Immigrants from El Salvador (10.4%, a difference of 0.010%), Immigrants from Sudan (10.4%, a difference of 0.12%), Filipino (10.4%, a difference of 0.13%), and Immigrants from Ethiopia (10.4%, a difference of 0.16%).
| Demographics | Rating | Rank | No Vehicles in Household |
| Indonesians | 56.7 /100 | #168 | Average 10.3% |
| Lumbee | 54.7 /100 | #169 | Average 10.3% |
| Immigrants | Latin America | 53.2 /100 | #170 | Average 10.4% |
| Hmong | 52.7 /100 | #171 | Average 10.4% |
| Brazilians | 51.7 /100 | #172 | Average 10.4% |
| Filipinos | 50.1 /100 | #173 | Average 10.4% |
| Immigrants | Sudan | 50.0 /100 | #174 | Average 10.4% |
| Immigrants | Burma/Myanmar | 49.1 /100 | #175 | Average 10.4% |
| French American Indians | 49.1 /100 | #176 | Average 10.4% |
| Immigrants | El Salvador | 49.1 /100 | #177 | Average 10.4% |
| Immigrants | Ethiopia | 48.0 /100 | #178 | Average 10.4% |
| Ethiopians | 45.8 /100 | #179 | Average 10.5% |
| Arabs | 45.3 /100 | #180 | Average 10.5% |
| Immigrants | Colombia | 44.1 /100 | #181 | Average 10.5% |
| Immigrants | Bulgaria | 43.8 /100 | #182 | Average 10.5% |
Demographics Similar to Zimbabweans by No Vehicles in Household
In terms of no vehicles in household, the demographic groups most similar to Zimbabweans are Spanish American (9.1%, a difference of 0.16%), Laotian (9.1%, a difference of 0.25%), Hispanic or Latino (9.1%, a difference of 0.52%), Mexican American Indian (9.1%, a difference of 0.60%), and Seminole (9.0%, a difference of 0.63%).
| Demographics | Rating | Rank | No Vehicles in Household |
| Immigrants | Central America | 98.5 /100 | #97 | Exceptional 8.9% |
| Slavs | 98.4 /100 | #98 | Exceptional 9.0% |
| Bulgarians | 98.4 /100 | #99 | Exceptional 9.0% |
| Asians | 98.3 /100 | #100 | Exceptional 9.0% |
| Pakistanis | 98.3 /100 | #101 | Exceptional 9.0% |
| Yugoslavians | 98.3 /100 | #102 | Exceptional 9.0% |
| Seminole | 98.3 /100 | #103 | Exceptional 9.0% |
| Zimbabweans | 98.0 /100 | #104 | Exceptional 9.0% |
| Spanish Americans | 97.9 /100 | #105 | Exceptional 9.1% |
| Laotians | 97.8 /100 | #106 | Exceptional 9.1% |
| Hispanics or Latinos | 97.7 /100 | #107 | Exceptional 9.1% |
| Mexican American Indians | 97.6 /100 | #108 | Exceptional 9.1% |
| Maltese | 97.6 /100 | #109 | Exceptional 9.1% |
| Delaware | 97.2 /100 | #110 | Exceptional 9.2% |
| Immigrants | Kuwait | 95.1 /100 | #111 | Exceptional 9.4% |