Lebanese vs Zimbabwean No Vehicles in Household
COMPARE
Lebanese
Zimbabwean
No Vehicles in Household
No Vehicles in Household Comparison
Lebanese
Zimbabweans
8.7%
NO VEHICLES IN HOUSEHOLD
99.3/ 100
METRIC RATING
85th/ 347
METRIC RANK
9.0%
NO VEHICLES IN HOUSEHOLD
98.0/ 100
METRIC RATING
104th/ 347
METRIC RANK
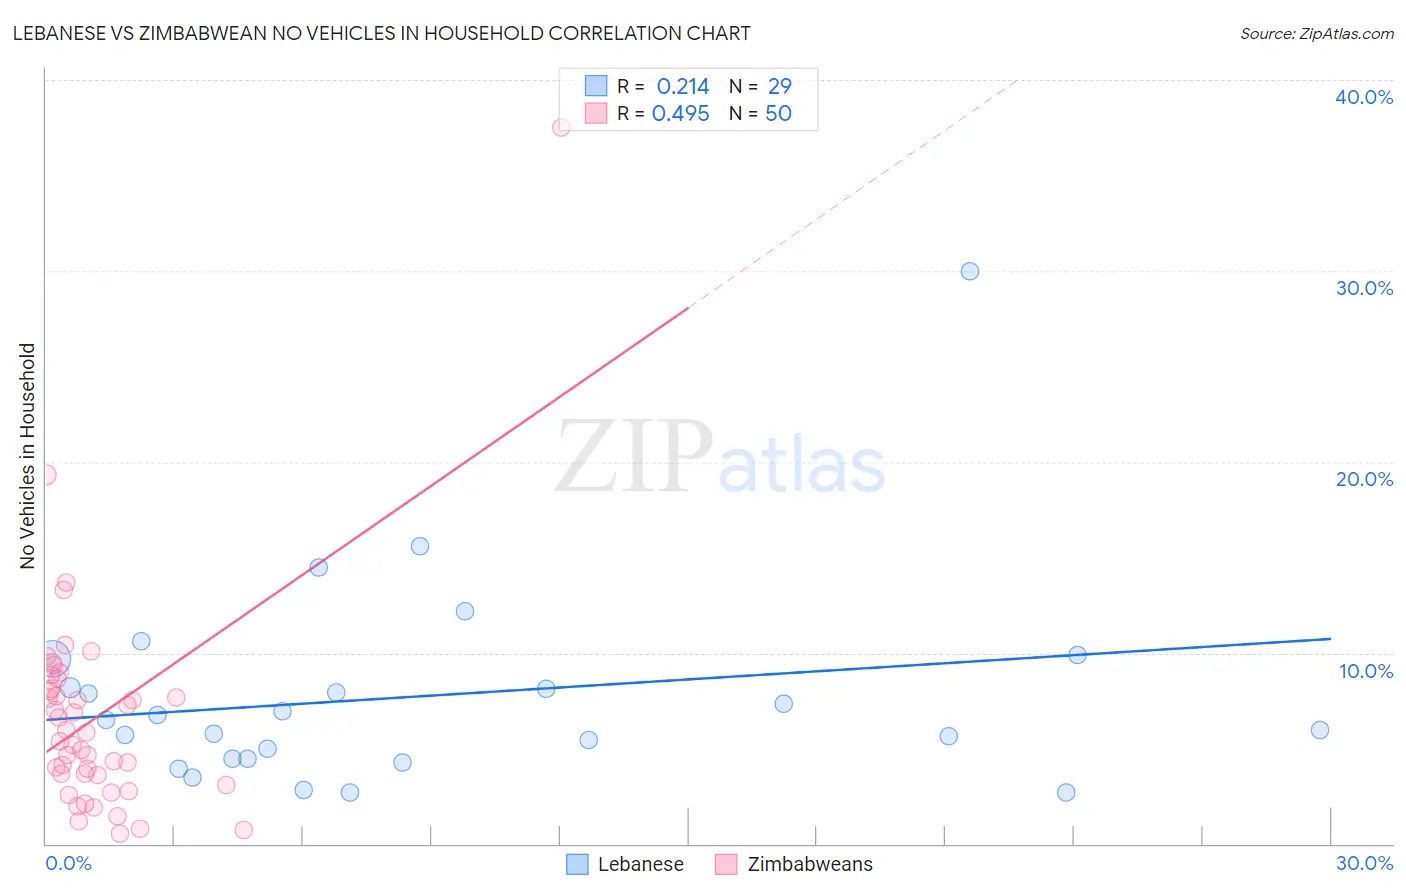
Lebanese vs Zimbabwean No Vehicles in Household Correlation Chart
The statistical analysis conducted on geographies consisting of 400,489,839 people shows a weak positive correlation between the proportion of Lebanese and percentage of households with no vehicle available in the United States with a correlation coefficient (R) of 0.214 and weighted average of 8.7%. Similarly, the statistical analysis conducted on geographies consisting of 69,183,978 people shows a moderate positive correlation between the proportion of Zimbabweans and percentage of households with no vehicle available in the United States with a correlation coefficient (R) of 0.495 and weighted average of 9.0%, a difference of 4.4%.
No Vehicles in Household Correlation Summary
| Measurement | Lebanese | Zimbabwean |
| Minimum | 2.7% | 0.49% |
| Maximum | 30.0% | 37.5% |
| Range | 27.3% | 37.0% |
| Mean | 7.7% | 6.6% |
| Median | 6.5% | 5.6% |
| Interquartile 25% (IQ1) | 4.4% | 3.6% |
| Interquartile 75% (IQ3) | 8.9% | 8.1% |
| Interquartile Range (IQR) | 4.5% | 4.5% |
| Standard Deviation (Sample) | 5.4% | 5.8% |
| Standard Deviation (Population) | 5.3% | 5.7% |
Demographics Similar to Lebanese and Zimbabweans by No Vehicles in Household
In terms of no vehicles in household, the demographic groups most similar to Lebanese are Immigrants from Jordan (8.7%, a difference of 0.060%), Bangladeshi (8.7%, a difference of 0.11%), Immigrants from England (8.7%, a difference of 0.33%), Osage (8.7%, a difference of 0.45%), and Immigrants from Cuba (8.7%, a difference of 0.59%). Similarly, the demographic groups most similar to Zimbabweans are Seminole (9.0%, a difference of 0.63%), Yugoslavian (9.0%, a difference of 0.64%), Pakistani (9.0%, a difference of 0.68%), Asian (9.0%, a difference of 0.72%), and Bulgarian (9.0%, a difference of 0.90%).
| Demographics | Rating | Rank | No Vehicles in Household |
| Immigrants | Jordan | 99.3 /100 | #84 | Exceptional 8.7% |
| Lebanese | 99.3 /100 | #85 | Exceptional 8.7% |
| Bangladeshis | 99.3 /100 | #86 | Exceptional 8.7% |
| Immigrants | England | 99.2 /100 | #87 | Exceptional 8.7% |
| Osage | 99.2 /100 | #88 | Exceptional 8.7% |
| Immigrants | Cuba | 99.2 /100 | #89 | Exceptional 8.7% |
| Bhutanese | 99.2 /100 | #90 | Exceptional 8.7% |
| Immigrants | Germany | 99.1 /100 | #91 | Exceptional 8.7% |
| Immigrants | Canada | 99.1 /100 | #92 | Exceptional 8.7% |
| Immigrants | North America | 99.1 /100 | #93 | Exceptional 8.7% |
| Austrians | 98.9 /100 | #94 | Exceptional 8.8% |
| Potawatomi | 98.8 /100 | #95 | Exceptional 8.8% |
| Immigrants | Bolivia | 98.7 /100 | #96 | Exceptional 8.9% |
| Immigrants | Central America | 98.5 /100 | #97 | Exceptional 8.9% |
| Slavs | 98.4 /100 | #98 | Exceptional 9.0% |
| Bulgarians | 98.4 /100 | #99 | Exceptional 9.0% |
| Asians | 98.3 /100 | #100 | Exceptional 9.0% |
| Pakistanis | 98.3 /100 | #101 | Exceptional 9.0% |
| Yugoslavians | 98.3 /100 | #102 | Exceptional 9.0% |
| Seminole | 98.3 /100 | #103 | Exceptional 9.0% |
| Zimbabweans | 98.0 /100 | #104 | Exceptional 9.0% |