Immigrants from Burma/Myanmar vs Thai No Vehicles in Household
COMPARE
Immigrants from Burma/Myanmar
Thai
No Vehicles in Household
No Vehicles in Household Comparison
Immigrants from Burma/Myanmar
Thais
10.4%
NO VEHICLES IN HOUSEHOLD
49.1/ 100
METRIC RATING
175th/ 347
METRIC RANK
8.2%
NO VEHICLES IN HOUSEHOLD
99.8/ 100
METRIC RATING
61st/ 347
METRIC RANK
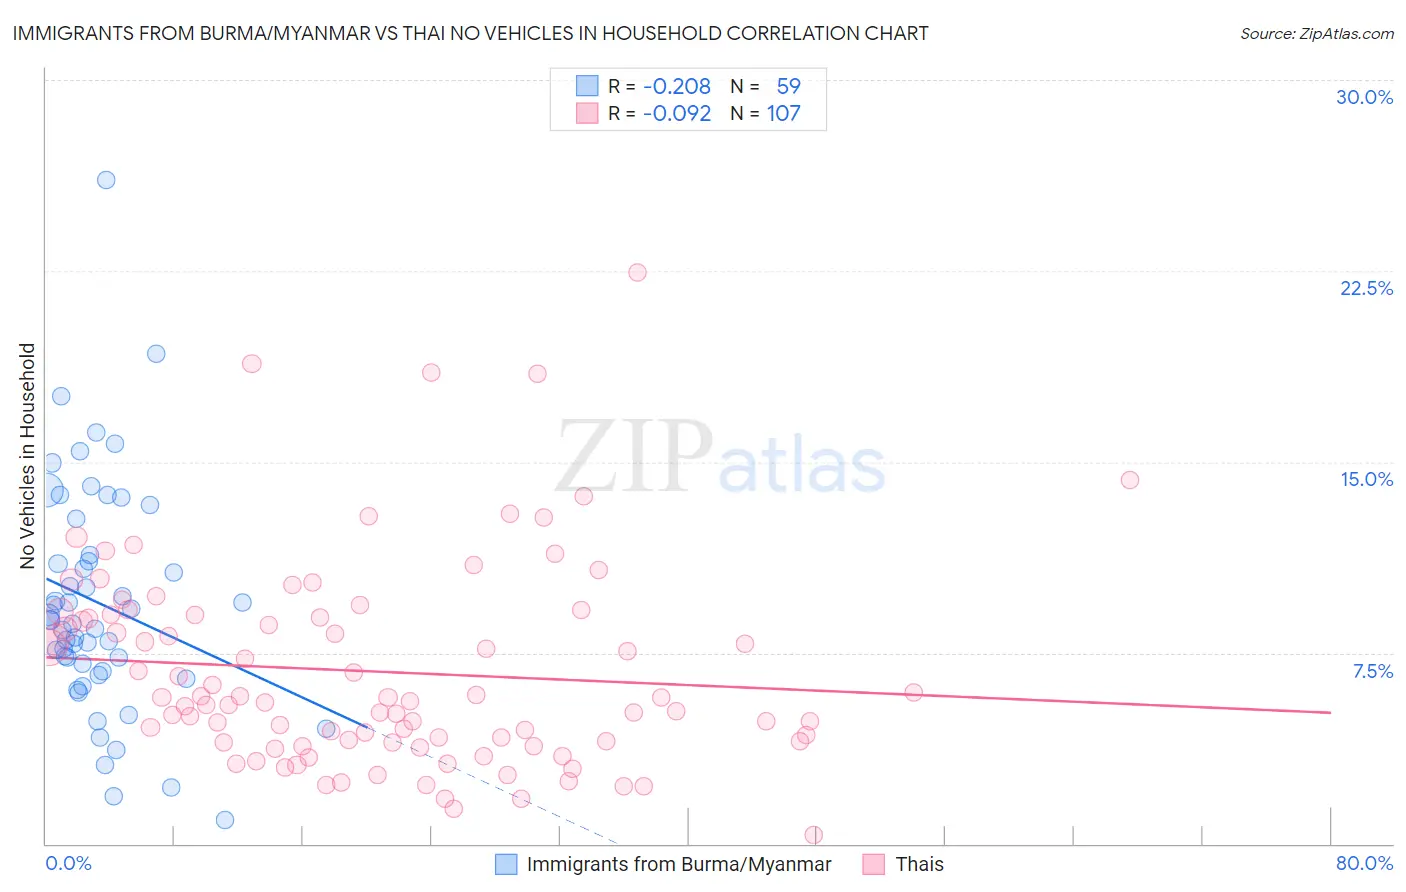
Immigrants from Burma/Myanmar vs Thai No Vehicles in Household Correlation Chart
The statistical analysis conducted on geographies consisting of 172,182,112 people shows a weak negative correlation between the proportion of Immigrants from Burma/Myanmar and percentage of households with no vehicle available in the United States with a correlation coefficient (R) of -0.208 and weighted average of 10.4%. Similarly, the statistical analysis conducted on geographies consisting of 455,165,569 people shows a slight negative correlation between the proportion of Thais and percentage of households with no vehicle available in the United States with a correlation coefficient (R) of -0.092 and weighted average of 8.2%, a difference of 27.3%.
No Vehicles in Household Correlation Summary
| Measurement | Immigrants from Burma/Myanmar | Thai |
| Minimum | 0.91% | 0.34% |
| Maximum | 26.1% | 22.4% |
| Range | 25.1% | 22.1% |
| Mean | 9.4% | 6.8% |
| Median | 8.8% | 5.6% |
| Interquartile 25% (IQ1) | 6.8% | 4.0% |
| Interquartile 75% (IQ3) | 11.3% | 9.0% |
| Interquartile Range (IQR) | 4.6% | 5.0% |
| Standard Deviation (Sample) | 4.5% | 4.0% |
| Standard Deviation (Population) | 4.5% | 4.0% |
Similar Demographics by No Vehicles in Household
Demographics Similar to Immigrants from Burma/Myanmar by No Vehicles in Household
In terms of no vehicles in household, the demographic groups most similar to Immigrants from Burma/Myanmar are French American Indian (10.4%, a difference of 0.0%), Immigrants from El Salvador (10.4%, a difference of 0.010%), Immigrants from Sudan (10.4%, a difference of 0.12%), Filipino (10.4%, a difference of 0.13%), and Immigrants from Ethiopia (10.4%, a difference of 0.16%).
| Demographics | Rating | Rank | No Vehicles in Household |
| Indonesians | 56.7 /100 | #168 | Average 10.3% |
| Lumbee | 54.7 /100 | #169 | Average 10.3% |
| Immigrants | Latin America | 53.2 /100 | #170 | Average 10.4% |
| Hmong | 52.7 /100 | #171 | Average 10.4% |
| Brazilians | 51.7 /100 | #172 | Average 10.4% |
| Filipinos | 50.1 /100 | #173 | Average 10.4% |
| Immigrants | Sudan | 50.0 /100 | #174 | Average 10.4% |
| Immigrants | Burma/Myanmar | 49.1 /100 | #175 | Average 10.4% |
| French American Indians | 49.1 /100 | #176 | Average 10.4% |
| Immigrants | El Salvador | 49.1 /100 | #177 | Average 10.4% |
| Immigrants | Ethiopia | 48.0 /100 | #178 | Average 10.4% |
| Ethiopians | 45.8 /100 | #179 | Average 10.5% |
| Arabs | 45.3 /100 | #180 | Average 10.5% |
| Immigrants | Colombia | 44.1 /100 | #181 | Average 10.5% |
| Immigrants | Bulgaria | 43.8 /100 | #182 | Average 10.5% |
Demographics Similar to Thais by No Vehicles in Household
In terms of no vehicles in household, the demographic groups most similar to Thais are Immigrants from Laos (8.2%, a difference of 0.17%), Immigrants from India (8.2%, a difference of 0.24%), Chinese (8.2%, a difference of 0.46%), Immigrants from Mexico (8.1%, a difference of 0.59%), and Venezuelan (8.1%, a difference of 0.69%).
| Demographics | Rating | Rank | No Vehicles in Household |
| Immigrants | Venezuela | 99.9 /100 | #54 | Exceptional 8.1% |
| Celtics | 99.9 /100 | #55 | Exceptional 8.1% |
| Immigrants | Afghanistan | 99.9 /100 | #56 | Exceptional 8.1% |
| Venezuelans | 99.8 /100 | #57 | Exceptional 8.1% |
| Immigrants | Mexico | 99.8 /100 | #58 | Exceptional 8.1% |
| Immigrants | India | 99.8 /100 | #59 | Exceptional 8.2% |
| Immigrants | Laos | 99.8 /100 | #60 | Exceptional 8.2% |
| Thais | 99.8 /100 | #61 | Exceptional 8.2% |
| Chinese | 99.8 /100 | #62 | Exceptional 8.2% |
| Slovaks | 99.8 /100 | #63 | Exceptional 8.3% |
| Croatians | 99.8 /100 | #64 | Exceptional 8.3% |
| Canadians | 99.7 /100 | #65 | Exceptional 8.3% |
| Palestinians | 99.7 /100 | #66 | Exceptional 8.3% |
| Immigrants | Scotland | 99.7 /100 | #67 | Exceptional 8.3% |
| Immigrants | Iran | 99.7 /100 | #68 | Exceptional 8.4% |