Immigrants from Burma/Myanmar vs Zimbabwean Seniors Poverty Over the Age of 65
COMPARE
Immigrants from Burma/Myanmar
Zimbabwean
Seniors Poverty Over the Age of 65
Seniors Poverty Over the Age of 65 Comparison
Immigrants from Burma/Myanmar
Zimbabweans
11.3%
SENIORS POVERTY OVER THE AGE OF 65
21.3/ 100
METRIC RATING
198th/ 347
METRIC RANK
9.6%
SENIORS POVERTY OVER THE AGE OF 65
99.6/ 100
METRIC RATING
42nd/ 347
METRIC RANK
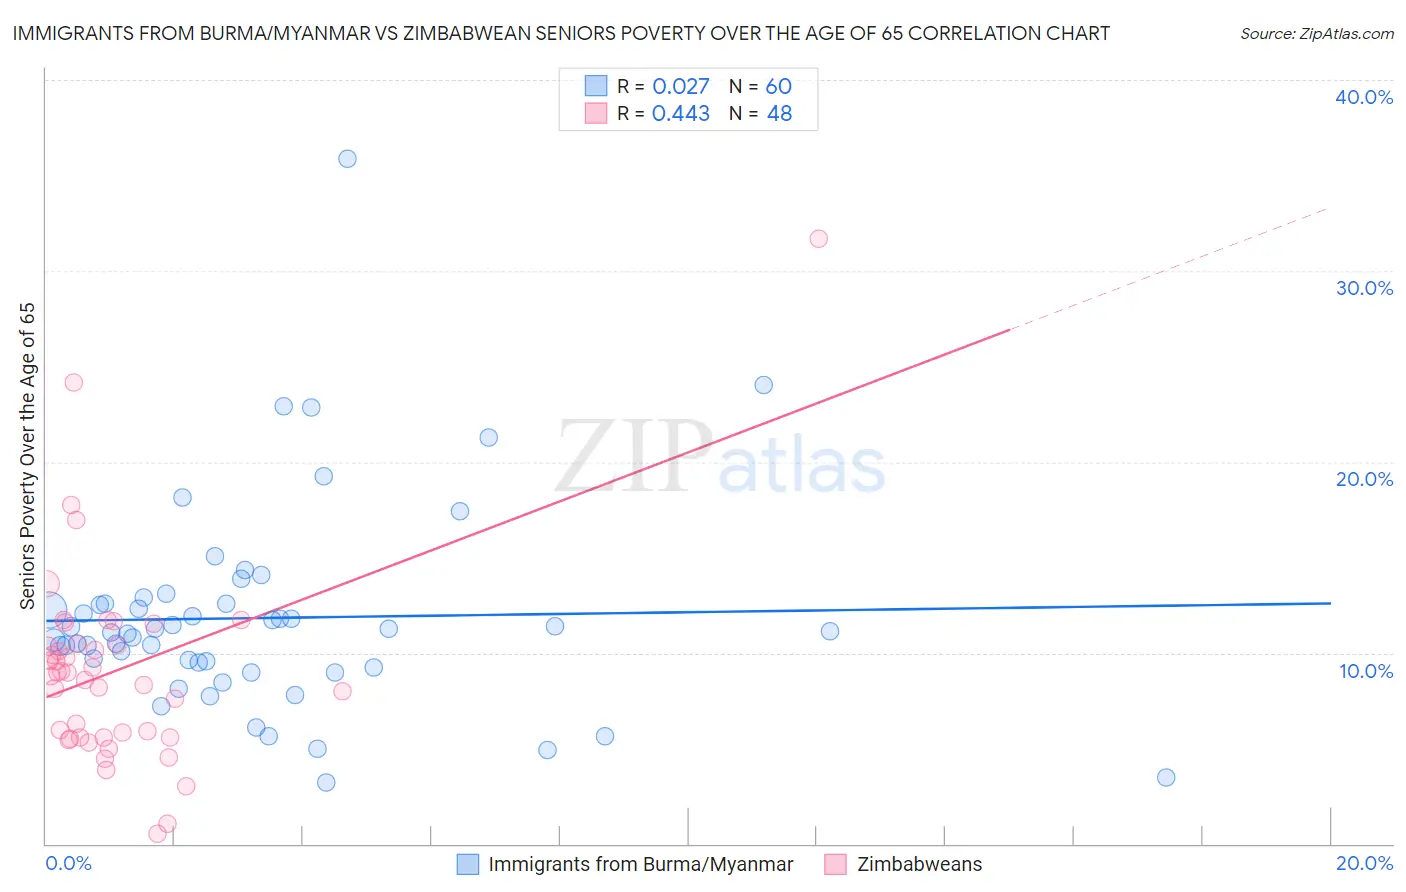
Immigrants from Burma/Myanmar vs Zimbabwean Seniors Poverty Over the Age of 65 Correlation Chart
The statistical analysis conducted on geographies consisting of 172,103,191 people shows no correlation between the proportion of Immigrants from Burma/Myanmar and poverty level among seniors over the age of 65 in the United States with a correlation coefficient (R) of 0.027 and weighted average of 11.3%. Similarly, the statistical analysis conducted on geographies consisting of 69,092,628 people shows a moderate positive correlation between the proportion of Zimbabweans and poverty level among seniors over the age of 65 in the United States with a correlation coefficient (R) of 0.443 and weighted average of 9.6%, a difference of 17.1%.
Seniors Poverty Over the Age of 65 Correlation Summary
| Measurement | Immigrants from Burma/Myanmar | Zimbabwean |
| Minimum | 3.2% | 0.55% |
| Maximum | 35.9% | 31.7% |
| Range | 32.6% | 31.2% |
| Mean | 11.8% | 9.1% |
| Median | 11.1% | 8.9% |
| Interquartile 25% (IQ1) | 9.4% | 5.6% |
| Interquartile 75% (IQ3) | 12.6% | 10.5% |
| Interquartile Range (IQR) | 3.2% | 4.9% |
| Standard Deviation (Sample) | 5.4% | 5.3% |
| Standard Deviation (Population) | 5.3% | 5.3% |
Similar Demographics by Seniors Poverty Over the Age of 65
Demographics Similar to Immigrants from Burma/Myanmar by Seniors Poverty Over the Age of 65
In terms of seniors poverty over the age of 65, the demographic groups most similar to Immigrants from Burma/Myanmar are Immigrants from Israel (11.3%, a difference of 0.13%), Alsatian (11.3%, a difference of 0.16%), Albanian (11.2%, a difference of 0.38%), Bangladeshi (11.2%, a difference of 0.47%), and Immigrants from Brazil (11.3%, a difference of 0.48%).
| Demographics | Rating | Rank | Seniors Poverty Over the Age of 65 |
| Immigrants | Uganda | 32.2 /100 | #191 | Fair 11.1% |
| Immigrants | Southern Europe | 30.1 /100 | #192 | Fair 11.1% |
| Taiwanese | 29.2 /100 | #193 | Fair 11.2% |
| Chileans | 27.8 /100 | #194 | Fair 11.2% |
| Immigrants | Vietnam | 26.6 /100 | #195 | Fair 11.2% |
| Bangladeshis | 25.2 /100 | #196 | Fair 11.2% |
| Albanians | 24.4 /100 | #197 | Fair 11.2% |
| Immigrants | Burma/Myanmar | 21.3 /100 | #198 | Fair 11.3% |
| Immigrants | Israel | 20.3 /100 | #199 | Fair 11.3% |
| Alsatians | 20.1 /100 | #200 | Fair 11.3% |
| Immigrants | Brazil | 17.8 /100 | #201 | Poor 11.3% |
| Costa Ricans | 17.0 /100 | #202 | Poor 11.3% |
| Immigrants | Zaire | 16.9 /100 | #203 | Poor 11.3% |
| Israelis | 16.5 /100 | #204 | Poor 11.3% |
| Brazilians | 15.4 /100 | #205 | Poor 11.3% |
Demographics Similar to Zimbabweans by Seniors Poverty Over the Age of 65
In terms of seniors poverty over the age of 65, the demographic groups most similar to Zimbabweans are Eastern European (9.6%, a difference of 0.10%), Immigrants from North Macedonia (9.6%, a difference of 0.15%), Austrian (9.6%, a difference of 0.20%), Assyrian/Chaldean/Syriac (9.6%, a difference of 0.32%), and Estonian (9.6%, a difference of 0.38%).
| Demographics | Rating | Rank | Seniors Poverty Over the Age of 65 |
| Latvians | 99.8 /100 | #35 | Exceptional 9.5% |
| Czechoslovakians | 99.8 /100 | #36 | Exceptional 9.5% |
| Scotch-Irish | 99.7 /100 | #37 | Exceptional 9.5% |
| Belgians | 99.7 /100 | #38 | Exceptional 9.5% |
| Greeks | 99.6 /100 | #39 | Exceptional 9.6% |
| Assyrians/Chaldeans/Syriacs | 99.6 /100 | #40 | Exceptional 9.6% |
| Immigrants | North Macedonia | 99.6 /100 | #41 | Exceptional 9.6% |
| Zimbabweans | 99.6 /100 | #42 | Exceptional 9.6% |
| Eastern Europeans | 99.6 /100 | #43 | Exceptional 9.6% |
| Austrians | 99.5 /100 | #44 | Exceptional 9.6% |
| Estonians | 99.5 /100 | #45 | Exceptional 9.6% |
| Immigrants | Taiwan | 99.5 /100 | #46 | Exceptional 9.7% |
| Immigrants | South Central Asia | 99.5 /100 | #47 | Exceptional 9.7% |
| French | 99.5 /100 | #48 | Exceptional 9.7% |
| Immigrants | Lithuania | 99.4 /100 | #49 | Exceptional 9.7% |