Immigrants from Burma/Myanmar vs West Indian No Vehicles in Household
COMPARE
Immigrants from Burma/Myanmar
West Indian
No Vehicles in Household
No Vehicles in Household Comparison
Immigrants from Burma/Myanmar
West Indians
10.4%
NO VEHICLES IN HOUSEHOLD
49.1/ 100
METRIC RATING
175th/ 347
METRIC RANK
23.7%
NO VEHICLES IN HOUSEHOLD
0.0/ 100
METRIC RATING
330th/ 347
METRIC RANK
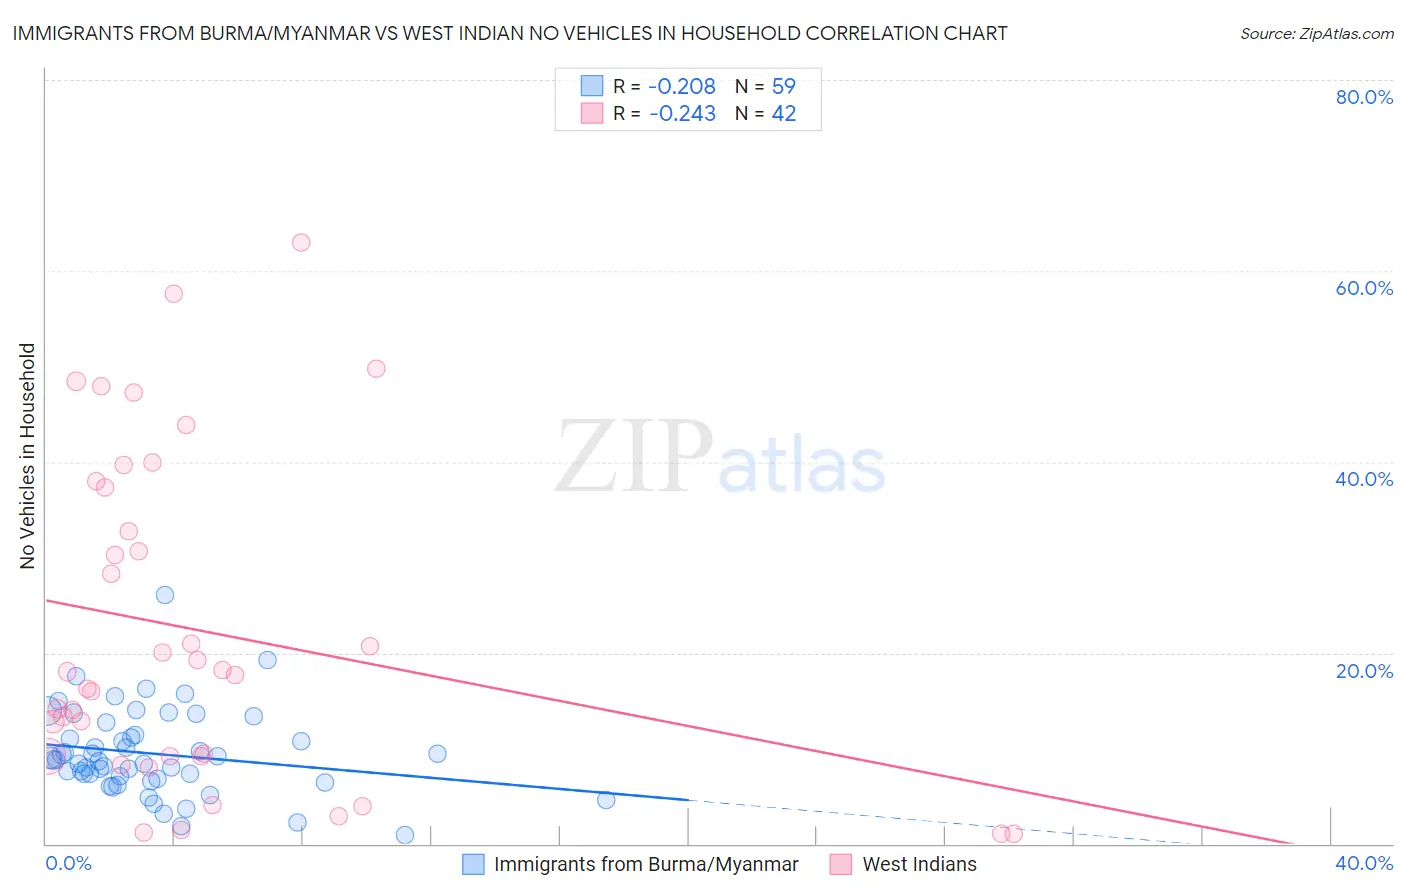
Immigrants from Burma/Myanmar vs West Indian No Vehicles in Household Correlation Chart
The statistical analysis conducted on geographies consisting of 172,182,112 people shows a weak negative correlation between the proportion of Immigrants from Burma/Myanmar and percentage of households with no vehicle available in the United States with a correlation coefficient (R) of -0.208 and weighted average of 10.4%. Similarly, the statistical analysis conducted on geographies consisting of 253,703,061 people shows a weak negative correlation between the proportion of West Indians and percentage of households with no vehicle available in the United States with a correlation coefficient (R) of -0.243 and weighted average of 23.7%, a difference of 127.6%.
No Vehicles in Household Correlation Summary
| Measurement | Immigrants from Burma/Myanmar | West Indian |
| Minimum | 0.91% | 1.0% |
| Maximum | 26.1% | 63.0% |
| Range | 25.1% | 62.0% |
| Mean | 9.4% | 22.3% |
| Median | 8.8% | 17.9% |
| Interquartile 25% (IQ1) | 6.8% | 9.2% |
| Interquartile 75% (IQ3) | 11.3% | 37.3% |
| Interquartile Range (IQR) | 4.6% | 28.1% |
| Standard Deviation (Sample) | 4.5% | 17.0% |
| Standard Deviation (Population) | 4.5% | 16.8% |
Similar Demographics by No Vehicles in Household
Demographics Similar to Immigrants from Burma/Myanmar by No Vehicles in Household
In terms of no vehicles in household, the demographic groups most similar to Immigrants from Burma/Myanmar are French American Indian (10.4%, a difference of 0.0%), Immigrants from El Salvador (10.4%, a difference of 0.010%), Immigrants from Sudan (10.4%, a difference of 0.12%), Filipino (10.4%, a difference of 0.13%), and Immigrants from Ethiopia (10.4%, a difference of 0.16%).
| Demographics | Rating | Rank | No Vehicles in Household |
| Indonesians | 56.7 /100 | #168 | Average 10.3% |
| Lumbee | 54.7 /100 | #169 | Average 10.3% |
| Immigrants | Latin America | 53.2 /100 | #170 | Average 10.4% |
| Hmong | 52.7 /100 | #171 | Average 10.4% |
| Brazilians | 51.7 /100 | #172 | Average 10.4% |
| Filipinos | 50.1 /100 | #173 | Average 10.4% |
| Immigrants | Sudan | 50.0 /100 | #174 | Average 10.4% |
| Immigrants | Burma/Myanmar | 49.1 /100 | #175 | Average 10.4% |
| French American Indians | 49.1 /100 | #176 | Average 10.4% |
| Immigrants | El Salvador | 49.1 /100 | #177 | Average 10.4% |
| Immigrants | Ethiopia | 48.0 /100 | #178 | Average 10.4% |
| Ethiopians | 45.8 /100 | #179 | Average 10.5% |
| Arabs | 45.3 /100 | #180 | Average 10.5% |
| Immigrants | Colombia | 44.1 /100 | #181 | Average 10.5% |
| Immigrants | Bulgaria | 43.8 /100 | #182 | Average 10.5% |
Demographics Similar to West Indians by No Vehicles in Household
In terms of no vehicles in household, the demographic groups most similar to West Indians are Trinidadian and Tobagonian (23.7%, a difference of 0.18%), Immigrants from Ecuador (23.8%, a difference of 0.51%), Immigrants from Trinidad and Tobago (24.6%, a difference of 3.9%), Ecuadorian (22.8%, a difference of 4.2%), and Immigrants from Dominica (22.2%, a difference of 6.6%).
| Demographics | Rating | Rank | No Vehicles in Household |
| Immigrants | Yemen | 0.0 /100 | #323 | Tragic 19.5% |
| Immigrants | Caribbean | 0.0 /100 | #324 | Tragic 19.6% |
| Senegalese | 0.0 /100 | #325 | Tragic 19.8% |
| Immigrants | West Indies | 0.0 /100 | #326 | Tragic 20.5% |
| Immigrants | Senegal | 0.0 /100 | #327 | Tragic 21.1% |
| Immigrants | Dominica | 0.0 /100 | #328 | Tragic 22.2% |
| Ecuadorians | 0.0 /100 | #329 | Tragic 22.8% |
| West Indians | 0.0 /100 | #330 | Tragic 23.7% |
| Trinidadians and Tobagonians | 0.0 /100 | #331 | Tragic 23.7% |
| Immigrants | Ecuador | 0.0 /100 | #332 | Tragic 23.8% |
| Immigrants | Trinidad and Tobago | 0.0 /100 | #333 | Tragic 24.6% |
| Immigrants | Bangladesh | 0.0 /100 | #334 | Tragic 25.8% |
| Barbadians | 0.0 /100 | #335 | Tragic 26.1% |
| Vietnamese | 0.0 /100 | #336 | Tragic 26.2% |
| Immigrants | Uzbekistan | 0.0 /100 | #337 | Tragic 26.7% |