Immigrants from Burma/Myanmar vs Austrian No Vehicles in Household
COMPARE
Immigrants from Burma/Myanmar
Austrian
No Vehicles in Household
No Vehicles in Household Comparison
Immigrants from Burma/Myanmar
Austrians
10.4%
NO VEHICLES IN HOUSEHOLD
49.1/ 100
METRIC RATING
175th/ 347
METRIC RANK
8.8%
NO VEHICLES IN HOUSEHOLD
98.9/ 100
METRIC RATING
94th/ 347
METRIC RANK
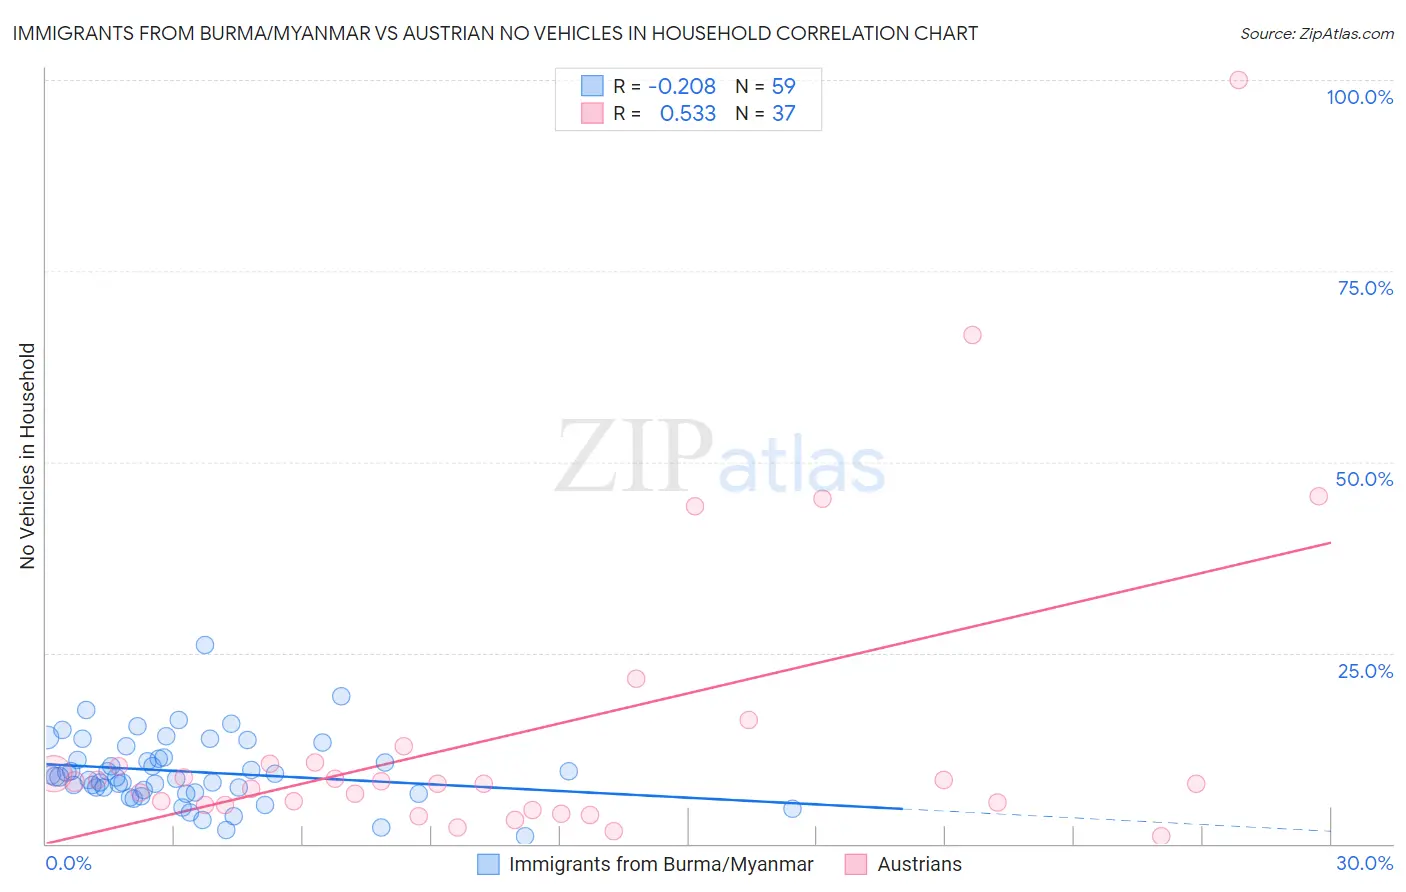
Immigrants from Burma/Myanmar vs Austrian No Vehicles in Household Correlation Chart
The statistical analysis conducted on geographies consisting of 172,182,112 people shows a weak negative correlation between the proportion of Immigrants from Burma/Myanmar and percentage of households with no vehicle available in the United States with a correlation coefficient (R) of -0.208 and weighted average of 10.4%. Similarly, the statistical analysis conducted on geographies consisting of 450,345,618 people shows a substantial positive correlation between the proportion of Austrians and percentage of households with no vehicle available in the United States with a correlation coefficient (R) of 0.533 and weighted average of 8.8%, a difference of 18.0%.
No Vehicles in Household Correlation Summary
| Measurement | Immigrants from Burma/Myanmar | Austrian |
| Minimum | 0.91% | 0.94% |
| Maximum | 26.1% | 100.0% |
| Range | 25.1% | 99.1% |
| Mean | 9.4% | 14.5% |
| Median | 8.8% | 7.9% |
| Interquartile 25% (IQ1) | 6.8% | 5.1% |
| Interquartile 75% (IQ3) | 11.3% | 10.5% |
| Interquartile Range (IQR) | 4.6% | 5.4% |
| Standard Deviation (Sample) | 4.5% | 20.4% |
| Standard Deviation (Population) | 4.5% | 20.1% |
Similar Demographics by No Vehicles in Household
Demographics Similar to Immigrants from Burma/Myanmar by No Vehicles in Household
In terms of no vehicles in household, the demographic groups most similar to Immigrants from Burma/Myanmar are French American Indian (10.4%, a difference of 0.0%), Immigrants from El Salvador (10.4%, a difference of 0.010%), Immigrants from Sudan (10.4%, a difference of 0.12%), Filipino (10.4%, a difference of 0.13%), and Immigrants from Ethiopia (10.4%, a difference of 0.16%).
| Demographics | Rating | Rank | No Vehicles in Household |
| Indonesians | 56.7 /100 | #168 | Average 10.3% |
| Lumbee | 54.7 /100 | #169 | Average 10.3% |
| Immigrants | Latin America | 53.2 /100 | #170 | Average 10.4% |
| Hmong | 52.7 /100 | #171 | Average 10.4% |
| Brazilians | 51.7 /100 | #172 | Average 10.4% |
| Filipinos | 50.1 /100 | #173 | Average 10.4% |
| Immigrants | Sudan | 50.0 /100 | #174 | Average 10.4% |
| Immigrants | Burma/Myanmar | 49.1 /100 | #175 | Average 10.4% |
| French American Indians | 49.1 /100 | #176 | Average 10.4% |
| Immigrants | El Salvador | 49.1 /100 | #177 | Average 10.4% |
| Immigrants | Ethiopia | 48.0 /100 | #178 | Average 10.4% |
| Ethiopians | 45.8 /100 | #179 | Average 10.5% |
| Arabs | 45.3 /100 | #180 | Average 10.5% |
| Immigrants | Colombia | 44.1 /100 | #181 | Average 10.5% |
| Immigrants | Bulgaria | 43.8 /100 | #182 | Average 10.5% |
Demographics Similar to Austrians by No Vehicles in Household
In terms of no vehicles in household, the demographic groups most similar to Austrians are Potawatomi (8.8%, a difference of 0.14%), Immigrants from Bolivia (8.9%, a difference of 0.43%), Immigrants from North America (8.7%, a difference of 0.95%), Immigrants from Central America (8.9%, a difference of 1.1%), and Immigrants from Canada (8.7%, a difference of 1.1%).
| Demographics | Rating | Rank | No Vehicles in Household |
| Immigrants | England | 99.2 /100 | #87 | Exceptional 8.7% |
| Osage | 99.2 /100 | #88 | Exceptional 8.7% |
| Immigrants | Cuba | 99.2 /100 | #89 | Exceptional 8.7% |
| Bhutanese | 99.2 /100 | #90 | Exceptional 8.7% |
| Immigrants | Germany | 99.1 /100 | #91 | Exceptional 8.7% |
| Immigrants | Canada | 99.1 /100 | #92 | Exceptional 8.7% |
| Immigrants | North America | 99.1 /100 | #93 | Exceptional 8.7% |
| Austrians | 98.9 /100 | #94 | Exceptional 8.8% |
| Potawatomi | 98.8 /100 | #95 | Exceptional 8.8% |
| Immigrants | Bolivia | 98.7 /100 | #96 | Exceptional 8.9% |
| Immigrants | Central America | 98.5 /100 | #97 | Exceptional 8.9% |
| Slavs | 98.4 /100 | #98 | Exceptional 9.0% |
| Bulgarians | 98.4 /100 | #99 | Exceptional 9.0% |
| Asians | 98.3 /100 | #100 | Exceptional 9.0% |
| Pakistanis | 98.3 /100 | #101 | Exceptional 9.0% |