Immigrants from Burma/Myanmar vs Immigrants from Switzerland No Vehicles in Household
COMPARE
Immigrants from Burma/Myanmar
Immigrants from Switzerland
No Vehicles in Household
No Vehicles in Household Comparison
Immigrants from Burma/Myanmar
Immigrants from Switzerland
10.4%
NO VEHICLES IN HOUSEHOLD
49.1/ 100
METRIC RATING
175th/ 347
METRIC RANK
12.3%
NO VEHICLES IN HOUSEHOLD
0.5/ 100
METRIC RATING
264th/ 347
METRIC RANK
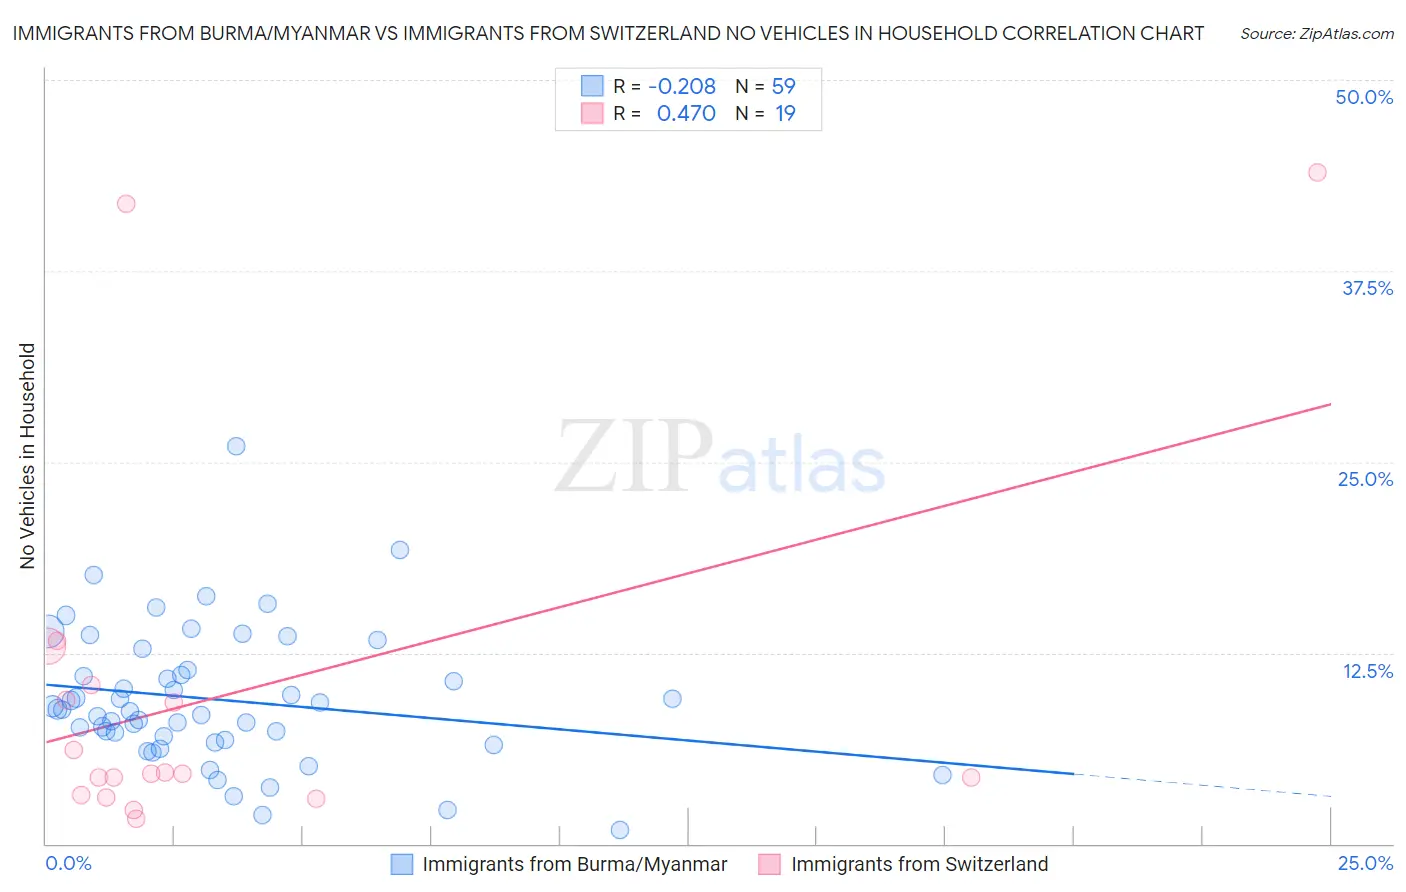
Immigrants from Burma/Myanmar vs Immigrants from Switzerland No Vehicles in Household Correlation Chart
The statistical analysis conducted on geographies consisting of 172,182,112 people shows a weak negative correlation between the proportion of Immigrants from Burma/Myanmar and percentage of households with no vehicle available in the United States with a correlation coefficient (R) of -0.208 and weighted average of 10.4%. Similarly, the statistical analysis conducted on geographies consisting of 147,956,430 people shows a moderate positive correlation between the proportion of Immigrants from Switzerland and percentage of households with no vehicle available in the United States with a correlation coefficient (R) of 0.470 and weighted average of 12.3%, a difference of 18.0%.
No Vehicles in Household Correlation Summary
| Measurement | Immigrants from Burma/Myanmar | Immigrants from Switzerland |
| Minimum | 0.91% | 1.6% |
| Maximum | 26.1% | 43.9% |
| Range | 25.1% | 42.3% |
| Mean | 9.4% | 9.9% |
| Median | 8.8% | 4.6% |
| Interquartile 25% (IQ1) | 6.8% | 3.2% |
| Interquartile 75% (IQ3) | 11.3% | 10.4% |
| Interquartile Range (IQR) | 4.6% | 7.3% |
| Standard Deviation (Sample) | 4.5% | 12.2% |
| Standard Deviation (Population) | 4.5% | 11.8% |
Similar Demographics by No Vehicles in Household
Demographics Similar to Immigrants from Burma/Myanmar by No Vehicles in Household
In terms of no vehicles in household, the demographic groups most similar to Immigrants from Burma/Myanmar are French American Indian (10.4%, a difference of 0.0%), Immigrants from El Salvador (10.4%, a difference of 0.010%), Immigrants from Sudan (10.4%, a difference of 0.12%), Filipino (10.4%, a difference of 0.13%), and Immigrants from Ethiopia (10.4%, a difference of 0.16%).
| Demographics | Rating | Rank | No Vehicles in Household |
| Indonesians | 56.7 /100 | #168 | Average 10.3% |
| Lumbee | 54.7 /100 | #169 | Average 10.3% |
| Immigrants | Latin America | 53.2 /100 | #170 | Average 10.4% |
| Hmong | 52.7 /100 | #171 | Average 10.4% |
| Brazilians | 51.7 /100 | #172 | Average 10.4% |
| Filipinos | 50.1 /100 | #173 | Average 10.4% |
| Immigrants | Sudan | 50.0 /100 | #174 | Average 10.4% |
| Immigrants | Burma/Myanmar | 49.1 /100 | #175 | Average 10.4% |
| French American Indians | 49.1 /100 | #176 | Average 10.4% |
| Immigrants | El Salvador | 49.1 /100 | #177 | Average 10.4% |
| Immigrants | Ethiopia | 48.0 /100 | #178 | Average 10.4% |
| Ethiopians | 45.8 /100 | #179 | Average 10.5% |
| Arabs | 45.3 /100 | #180 | Average 10.5% |
| Immigrants | Colombia | 44.1 /100 | #181 | Average 10.5% |
| Immigrants | Bulgaria | 43.8 /100 | #182 | Average 10.5% |
Demographics Similar to Immigrants from Switzerland by No Vehicles in Household
In terms of no vehicles in household, the demographic groups most similar to Immigrants from Switzerland are African (12.3%, a difference of 0.25%), Immigrants from Egypt (12.2%, a difference of 0.46%), Immigrants from Liberia (12.2%, a difference of 0.61%), Subsaharan African (12.2%, a difference of 0.69%), and Macedonian (12.2%, a difference of 1.1%).
| Demographics | Rating | Rank | No Vehicles in Household |
| Nigerians | 0.9 /100 | #257 | Tragic 12.1% |
| South American Indians | 0.9 /100 | #258 | Tragic 12.1% |
| Immigrants | Latvia | 0.8 /100 | #259 | Tragic 12.1% |
| Macedonians | 0.7 /100 | #260 | Tragic 12.2% |
| Sub-Saharan Africans | 0.6 /100 | #261 | Tragic 12.2% |
| Immigrants | Liberia | 0.6 /100 | #262 | Tragic 12.2% |
| Immigrants | Egypt | 0.6 /100 | #263 | Tragic 12.2% |
| Immigrants | Switzerland | 0.5 /100 | #264 | Tragic 12.3% |
| Africans | 0.4 /100 | #265 | Tragic 12.3% |
| Israelis | 0.3 /100 | #266 | Tragic 12.4% |
| Immigrants | Europe | 0.3 /100 | #267 | Tragic 12.5% |
| Immigrants | Africa | 0.2 /100 | #268 | Tragic 12.5% |
| Panamanians | 0.2 /100 | #269 | Tragic 12.5% |
| Immigrants | Northern Africa | 0.2 /100 | #270 | Tragic 12.6% |
| Immigrants | Morocco | 0.2 /100 | #271 | Tragic 12.6% |