Liberian vs Zimbabwean No Vehicles in Household
COMPARE
Liberian
Zimbabwean
No Vehicles in Household
No Vehicles in Household Comparison
Liberians
Zimbabweans
12.0%
NO VEHICLES IN HOUSEHOLD
1.2/ 100
METRIC RATING
256th/ 347
METRIC RANK
9.0%
NO VEHICLES IN HOUSEHOLD
98.0/ 100
METRIC RATING
104th/ 347
METRIC RANK
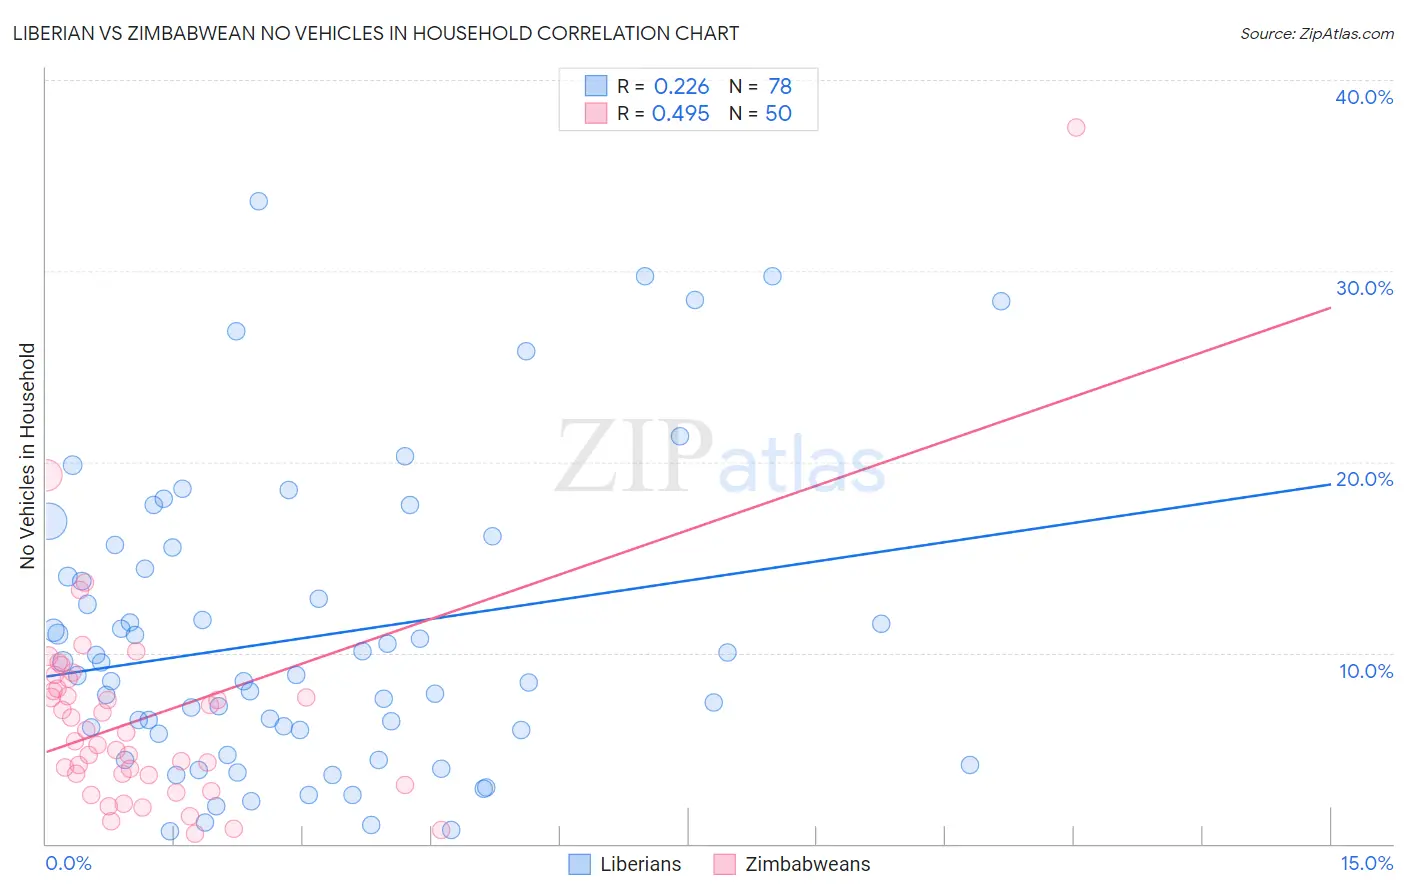
Liberian vs Zimbabwean No Vehicles in Household Correlation Chart
The statistical analysis conducted on geographies consisting of 118,010,925 people shows a weak positive correlation between the proportion of Liberians and percentage of households with no vehicle available in the United States with a correlation coefficient (R) of 0.226 and weighted average of 12.0%. Similarly, the statistical analysis conducted on geographies consisting of 69,183,978 people shows a moderate positive correlation between the proportion of Zimbabweans and percentage of households with no vehicle available in the United States with a correlation coefficient (R) of 0.495 and weighted average of 9.0%, a difference of 32.5%.
No Vehicles in Household Correlation Summary
| Measurement | Liberian | Zimbabwean |
| Minimum | 0.64% | 0.49% |
| Maximum | 33.6% | 37.5% |
| Range | 33.0% | 37.0% |
| Mean | 10.8% | 6.6% |
| Median | 8.8% | 5.6% |
| Interquartile 25% (IQ1) | 5.7% | 3.6% |
| Interquartile 75% (IQ3) | 14.4% | 8.1% |
| Interquartile Range (IQR) | 8.7% | 4.5% |
| Standard Deviation (Sample) | 7.7% | 5.8% |
| Standard Deviation (Population) | 7.6% | 5.7% |
Similar Demographics by No Vehicles in Household
Demographics Similar to Liberians by No Vehicles in Household
In terms of no vehicles in household, the demographic groups most similar to Liberians are Honduran (12.0%, a difference of 0.050%), Immigrants from Uruguay (11.9%, a difference of 0.32%), Egyptian (11.9%, a difference of 0.64%), Immigrants from Serbia (11.9%, a difference of 0.71%), and Nigerian (12.1%, a difference of 0.74%).
| Demographics | Rating | Rank | No Vehicles in Household |
| Immigrants | Nigeria | 1.9 /100 | #249 | Tragic 11.8% |
| Paiute | 1.8 /100 | #250 | Tragic 11.8% |
| Blacks/African Americans | 1.6 /100 | #251 | Tragic 11.9% |
| Immigrants | Serbia | 1.5 /100 | #252 | Tragic 11.9% |
| Egyptians | 1.4 /100 | #253 | Tragic 11.9% |
| Immigrants | Uruguay | 1.3 /100 | #254 | Tragic 11.9% |
| Hondurans | 1.2 /100 | #255 | Tragic 12.0% |
| Liberians | 1.2 /100 | #256 | Tragic 12.0% |
| Nigerians | 0.9 /100 | #257 | Tragic 12.1% |
| South American Indians | 0.9 /100 | #258 | Tragic 12.1% |
| Immigrants | Latvia | 0.8 /100 | #259 | Tragic 12.1% |
| Macedonians | 0.7 /100 | #260 | Tragic 12.2% |
| Sub-Saharan Africans | 0.6 /100 | #261 | Tragic 12.2% |
| Immigrants | Liberia | 0.6 /100 | #262 | Tragic 12.2% |
| Immigrants | Egypt | 0.6 /100 | #263 | Tragic 12.2% |
Demographics Similar to Zimbabweans by No Vehicles in Household
In terms of no vehicles in household, the demographic groups most similar to Zimbabweans are Spanish American (9.1%, a difference of 0.16%), Laotian (9.1%, a difference of 0.25%), Hispanic or Latino (9.1%, a difference of 0.52%), Mexican American Indian (9.1%, a difference of 0.60%), and Seminole (9.0%, a difference of 0.63%).
| Demographics | Rating | Rank | No Vehicles in Household |
| Immigrants | Central America | 98.5 /100 | #97 | Exceptional 8.9% |
| Slavs | 98.4 /100 | #98 | Exceptional 9.0% |
| Bulgarians | 98.4 /100 | #99 | Exceptional 9.0% |
| Asians | 98.3 /100 | #100 | Exceptional 9.0% |
| Pakistanis | 98.3 /100 | #101 | Exceptional 9.0% |
| Yugoslavians | 98.3 /100 | #102 | Exceptional 9.0% |
| Seminole | 98.3 /100 | #103 | Exceptional 9.0% |
| Zimbabweans | 98.0 /100 | #104 | Exceptional 9.0% |
| Spanish Americans | 97.9 /100 | #105 | Exceptional 9.1% |
| Laotians | 97.8 /100 | #106 | Exceptional 9.1% |
| Hispanics or Latinos | 97.7 /100 | #107 | Exceptional 9.1% |
| Mexican American Indians | 97.6 /100 | #108 | Exceptional 9.1% |
| Maltese | 97.6 /100 | #109 | Exceptional 9.1% |
| Delaware | 97.2 /100 | #110 | Exceptional 9.2% |
| Immigrants | Kuwait | 95.1 /100 | #111 | Exceptional 9.4% |