Immigrants from Burma/Myanmar vs Ugandan No Vehicles in Household
COMPARE
Immigrants from Burma/Myanmar
Ugandan
No Vehicles in Household
No Vehicles in Household Comparison
Immigrants from Burma/Myanmar
Ugandans
10.4%
NO VEHICLES IN HOUSEHOLD
49.1/ 100
METRIC RATING
175th/ 347
METRIC RANK
11.4%
NO VEHICLES IN HOUSEHOLD
5.3/ 100
METRIC RATING
229th/ 347
METRIC RANK
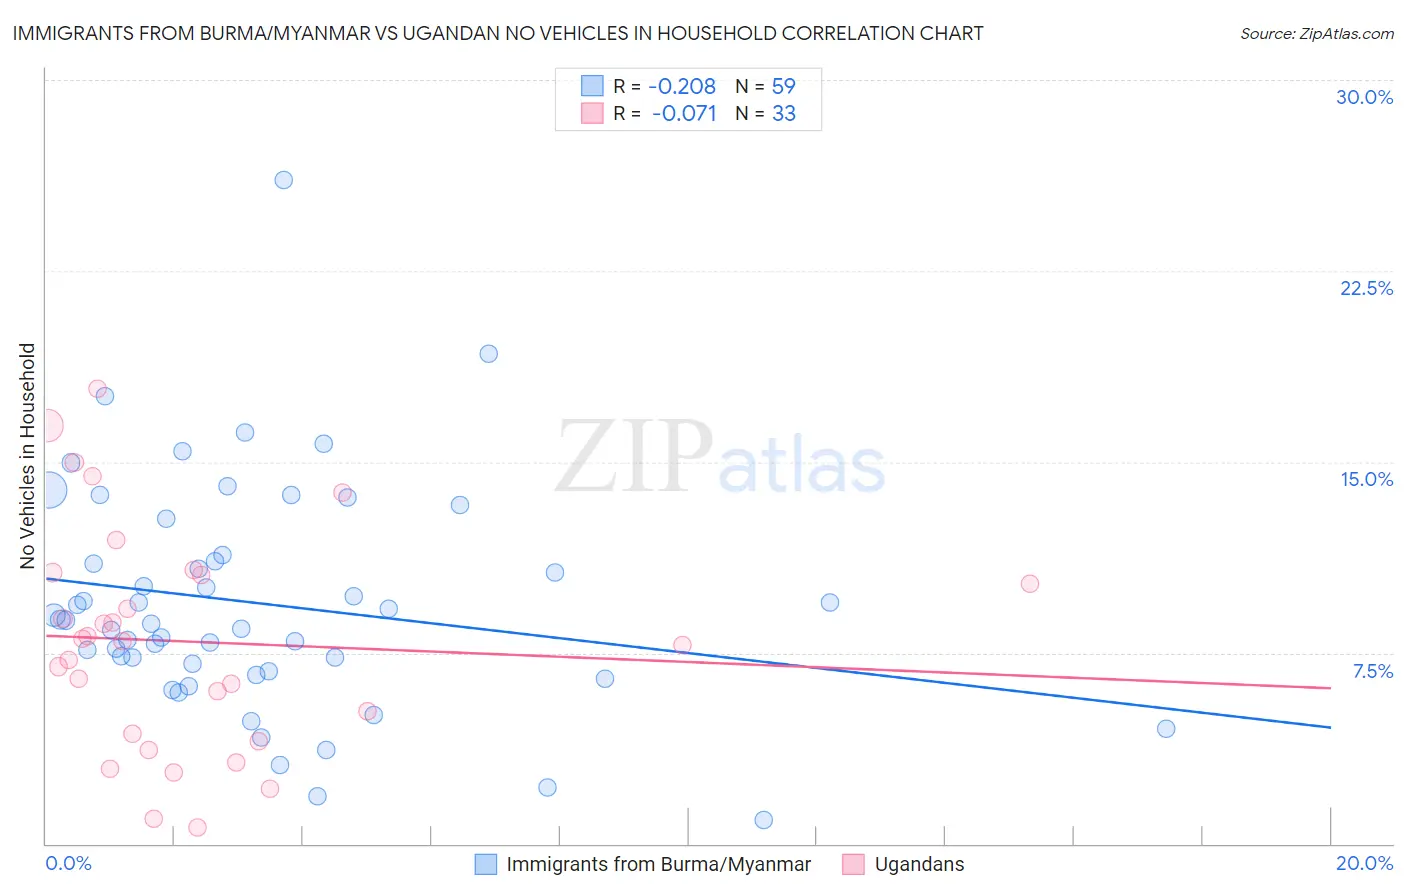
Immigrants from Burma/Myanmar vs Ugandan No Vehicles in Household Correlation Chart
The statistical analysis conducted on geographies consisting of 172,182,112 people shows a weak negative correlation between the proportion of Immigrants from Burma/Myanmar and percentage of households with no vehicle available in the United States with a correlation coefficient (R) of -0.208 and weighted average of 10.4%. Similarly, the statistical analysis conducted on geographies consisting of 93,973,141 people shows a slight negative correlation between the proportion of Ugandans and percentage of households with no vehicle available in the United States with a correlation coefficient (R) of -0.071 and weighted average of 11.4%, a difference of 9.7%.
No Vehicles in Household Correlation Summary
| Measurement | Immigrants from Burma/Myanmar | Ugandan |
| Minimum | 0.91% | 0.63% |
| Maximum | 26.1% | 17.9% |
| Range | 25.1% | 17.2% |
| Mean | 9.4% | 7.9% |
| Median | 8.8% | 8.0% |
| Interquartile 25% (IQ1) | 6.8% | 4.2% |
| Interquartile 75% (IQ3) | 11.3% | 10.6% |
| Interquartile Range (IQR) | 4.6% | 6.4% |
| Standard Deviation (Sample) | 4.5% | 4.4% |
| Standard Deviation (Population) | 4.5% | 4.3% |
Similar Demographics by No Vehicles in Household
Demographics Similar to Immigrants from Burma/Myanmar by No Vehicles in Household
In terms of no vehicles in household, the demographic groups most similar to Immigrants from Burma/Myanmar are French American Indian (10.4%, a difference of 0.0%), Immigrants from El Salvador (10.4%, a difference of 0.010%), Immigrants from Sudan (10.4%, a difference of 0.12%), Filipino (10.4%, a difference of 0.13%), and Immigrants from Ethiopia (10.4%, a difference of 0.16%).
| Demographics | Rating | Rank | No Vehicles in Household |
| Indonesians | 56.7 /100 | #168 | Average 10.3% |
| Lumbee | 54.7 /100 | #169 | Average 10.3% |
| Immigrants | Latin America | 53.2 /100 | #170 | Average 10.4% |
| Hmong | 52.7 /100 | #171 | Average 10.4% |
| Brazilians | 51.7 /100 | #172 | Average 10.4% |
| Filipinos | 50.1 /100 | #173 | Average 10.4% |
| Immigrants | Sudan | 50.0 /100 | #174 | Average 10.4% |
| Immigrants | Burma/Myanmar | 49.1 /100 | #175 | Average 10.4% |
| French American Indians | 49.1 /100 | #176 | Average 10.4% |
| Immigrants | El Salvador | 49.1 /100 | #177 | Average 10.4% |
| Immigrants | Ethiopia | 48.0 /100 | #178 | Average 10.4% |
| Ethiopians | 45.8 /100 | #179 | Average 10.5% |
| Arabs | 45.3 /100 | #180 | Average 10.5% |
| Immigrants | Colombia | 44.1 /100 | #181 | Average 10.5% |
| Immigrants | Bulgaria | 43.8 /100 | #182 | Average 10.5% |
Demographics Similar to Ugandans by No Vehicles in Household
In terms of no vehicles in household, the demographic groups most similar to Ugandans are Immigrants from Romania (11.4%, a difference of 0.040%), Immigrants from Pakistan (11.4%, a difference of 0.080%), Immigrants from Somalia (11.4%, a difference of 0.10%), Immigrants from Norway (11.4%, a difference of 0.13%), and Immigrants from Japan (11.4%, a difference of 0.13%).
| Demographics | Rating | Rank | No Vehicles in Household |
| Immigrants | South America | 8.0 /100 | #222 | Tragic 11.3% |
| Uruguayans | 7.7 /100 | #223 | Tragic 11.3% |
| Immigrants | Hong Kong | 7.2 /100 | #224 | Tragic 11.3% |
| Immigrants | Sierra Leone | 6.4 /100 | #225 | Tragic 11.3% |
| Immigrants | Somalia | 5.4 /100 | #226 | Tragic 11.4% |
| Immigrants | Pakistan | 5.4 /100 | #227 | Tragic 11.4% |
| Immigrants | Romania | 5.3 /100 | #228 | Tragic 11.4% |
| Ugandans | 5.3 /100 | #229 | Tragic 11.4% |
| Immigrants | Norway | 5.1 /100 | #230 | Tragic 11.4% |
| Immigrants | Japan | 5.1 /100 | #231 | Tragic 11.4% |
| Immigrants | Turkey | 4.8 /100 | #232 | Tragic 11.5% |
| Houma | 4.7 /100 | #233 | Tragic 11.5% |
| Immigrants | Peru | 4.5 /100 | #234 | Tragic 11.5% |
| Kiowa | 4.0 /100 | #235 | Tragic 11.5% |
| Cree | 3.5 /100 | #236 | Tragic 11.6% |