Immigrants from Burma/Myanmar vs Immigrants from Taiwan No Vehicles in Household
COMPARE
Immigrants from Burma/Myanmar
Immigrants from Taiwan
No Vehicles in Household
No Vehicles in Household Comparison
Immigrants from Burma/Myanmar
Immigrants from Taiwan
10.4%
NO VEHICLES IN HOUSEHOLD
49.1/ 100
METRIC RATING
175th/ 347
METRIC RANK
7.7%
NO VEHICLES IN HOUSEHOLD
100.0/ 100
METRIC RATING
33rd/ 347
METRIC RANK
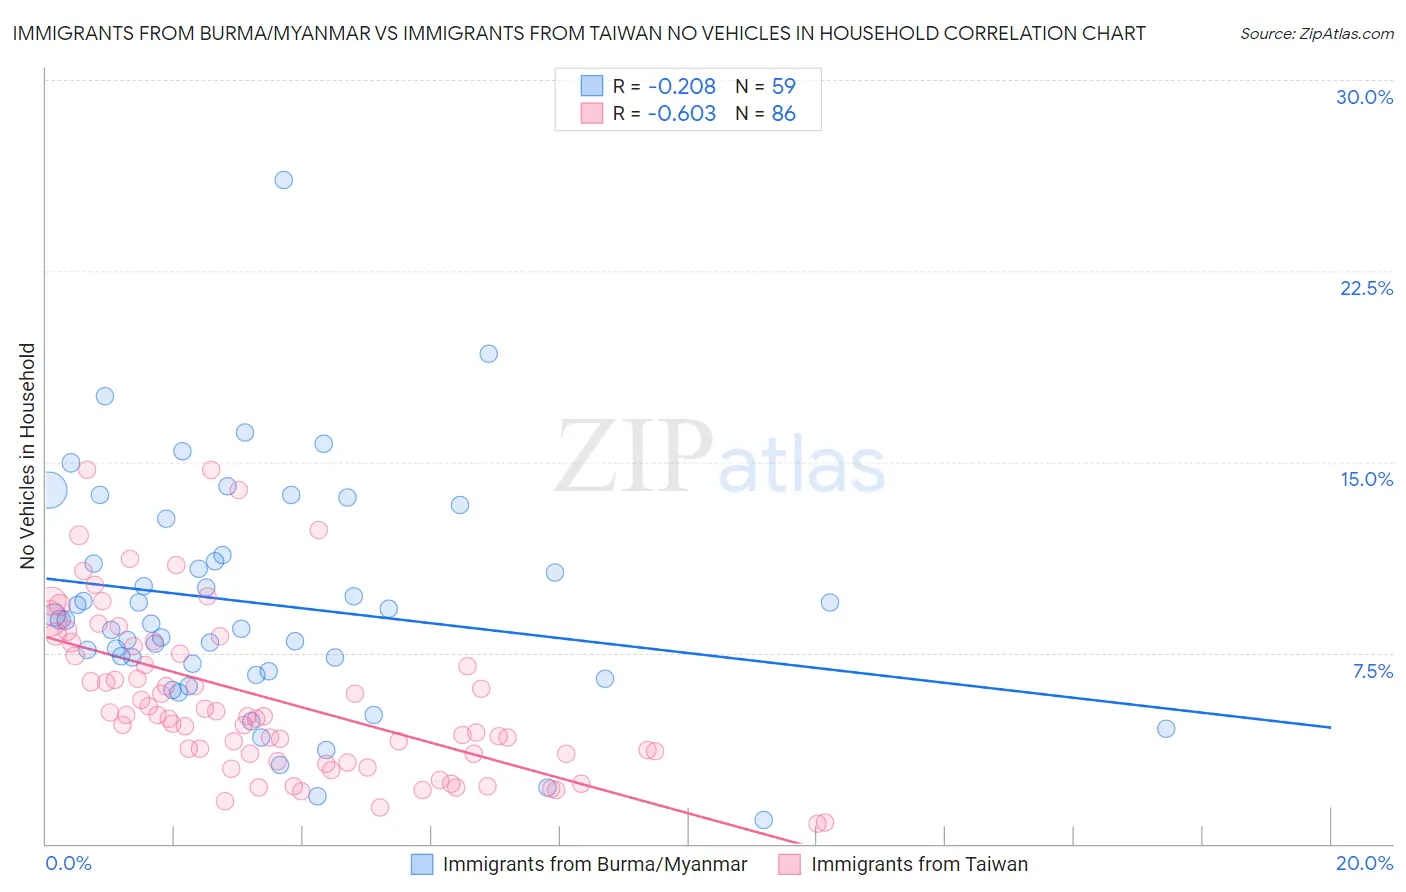
Immigrants from Burma/Myanmar vs Immigrants from Taiwan No Vehicles in Household Correlation Chart
The statistical analysis conducted on geographies consisting of 172,182,112 people shows a weak negative correlation between the proportion of Immigrants from Burma/Myanmar and percentage of households with no vehicle available in the United States with a correlation coefficient (R) of -0.208 and weighted average of 10.4%. Similarly, the statistical analysis conducted on geographies consisting of 276,659,382 people shows a significant negative correlation between the proportion of Immigrants from Taiwan and percentage of households with no vehicle available in the United States with a correlation coefficient (R) of -0.603 and weighted average of 7.7%, a difference of 35.0%.
No Vehicles in Household Correlation Summary
| Measurement | Immigrants from Burma/Myanmar | Immigrants from Taiwan |
| Minimum | 0.91% | 0.80% |
| Maximum | 26.1% | 14.7% |
| Range | 25.1% | 13.9% |
| Mean | 9.4% | 5.7% |
| Median | 8.8% | 5.0% |
| Interquartile 25% (IQ1) | 6.8% | 3.5% |
| Interquartile 75% (IQ3) | 11.3% | 7.8% |
| Interquartile Range (IQR) | 4.6% | 4.2% |
| Standard Deviation (Sample) | 4.5% | 3.2% |
| Standard Deviation (Population) | 4.5% | 3.2% |
Similar Demographics by No Vehicles in Household
Demographics Similar to Immigrants from Burma/Myanmar by No Vehicles in Household
In terms of no vehicles in household, the demographic groups most similar to Immigrants from Burma/Myanmar are French American Indian (10.4%, a difference of 0.0%), Immigrants from El Salvador (10.4%, a difference of 0.010%), Immigrants from Sudan (10.4%, a difference of 0.12%), Filipino (10.4%, a difference of 0.13%), and Immigrants from Ethiopia (10.4%, a difference of 0.16%).
| Demographics | Rating | Rank | No Vehicles in Household |
| Indonesians | 56.7 /100 | #168 | Average 10.3% |
| Lumbee | 54.7 /100 | #169 | Average 10.3% |
| Immigrants | Latin America | 53.2 /100 | #170 | Average 10.4% |
| Hmong | 52.7 /100 | #171 | Average 10.4% |
| Brazilians | 51.7 /100 | #172 | Average 10.4% |
| Filipinos | 50.1 /100 | #173 | Average 10.4% |
| Immigrants | Sudan | 50.0 /100 | #174 | Average 10.4% |
| Immigrants | Burma/Myanmar | 49.1 /100 | #175 | Average 10.4% |
| French American Indians | 49.1 /100 | #176 | Average 10.4% |
| Immigrants | El Salvador | 49.1 /100 | #177 | Average 10.4% |
| Immigrants | Ethiopia | 48.0 /100 | #178 | Average 10.4% |
| Ethiopians | 45.8 /100 | #179 | Average 10.5% |
| Arabs | 45.3 /100 | #180 | Average 10.5% |
| Immigrants | Colombia | 44.1 /100 | #181 | Average 10.5% |
| Immigrants | Bulgaria | 43.8 /100 | #182 | Average 10.5% |
Demographics Similar to Immigrants from Taiwan by No Vehicles in Household
In terms of no vehicles in household, the demographic groups most similar to Immigrants from Taiwan are Malaysian (7.7%, a difference of 0.11%), Immigrants from Vietnam (7.7%, a difference of 0.13%), Cherokee (7.7%, a difference of 0.27%), Native Hawaiian (7.7%, a difference of 0.36%), and Iraqi (7.7%, a difference of 0.41%).
| Demographics | Rating | Rank | No Vehicles in Household |
| Sri Lankans | 100.0 /100 | #26 | Exceptional 7.6% |
| British | 100.0 /100 | #27 | Exceptional 7.6% |
| Samoans | 100.0 /100 | #28 | Exceptional 7.6% |
| Americans | 100.0 /100 | #29 | Exceptional 7.7% |
| Finns | 100.0 /100 | #30 | Exceptional 7.7% |
| Native Hawaiians | 100.0 /100 | #31 | Exceptional 7.7% |
| Malaysians | 100.0 /100 | #32 | Exceptional 7.7% |
| Immigrants | Taiwan | 100.0 /100 | #33 | Exceptional 7.7% |
| Immigrants | Vietnam | 100.0 /100 | #34 | Exceptional 7.7% |
| Cherokee | 99.9 /100 | #35 | Exceptional 7.7% |
| Iraqis | 99.9 /100 | #36 | Exceptional 7.7% |
| Basques | 99.9 /100 | #37 | Exceptional 7.8% |
| Creek | 99.9 /100 | #38 | Exceptional 7.8% |
| Immigrants | Fiji | 99.9 /100 | #39 | Exceptional 7.8% |
| Czechoslovakians | 99.9 /100 | #40 | Exceptional 7.8% |