Immigrants from Western Asia vs Zimbabwean No Vehicles in Household
COMPARE
Immigrants from Western Asia
Zimbabwean
No Vehicles in Household
No Vehicles in Household Comparison
Immigrants from Western Asia
Zimbabweans
11.0%
NO VEHICLES IN HOUSEHOLD
13.9/ 100
METRIC RATING
212th/ 347
METRIC RANK
9.0%
NO VEHICLES IN HOUSEHOLD
98.0/ 100
METRIC RATING
104th/ 347
METRIC RANK
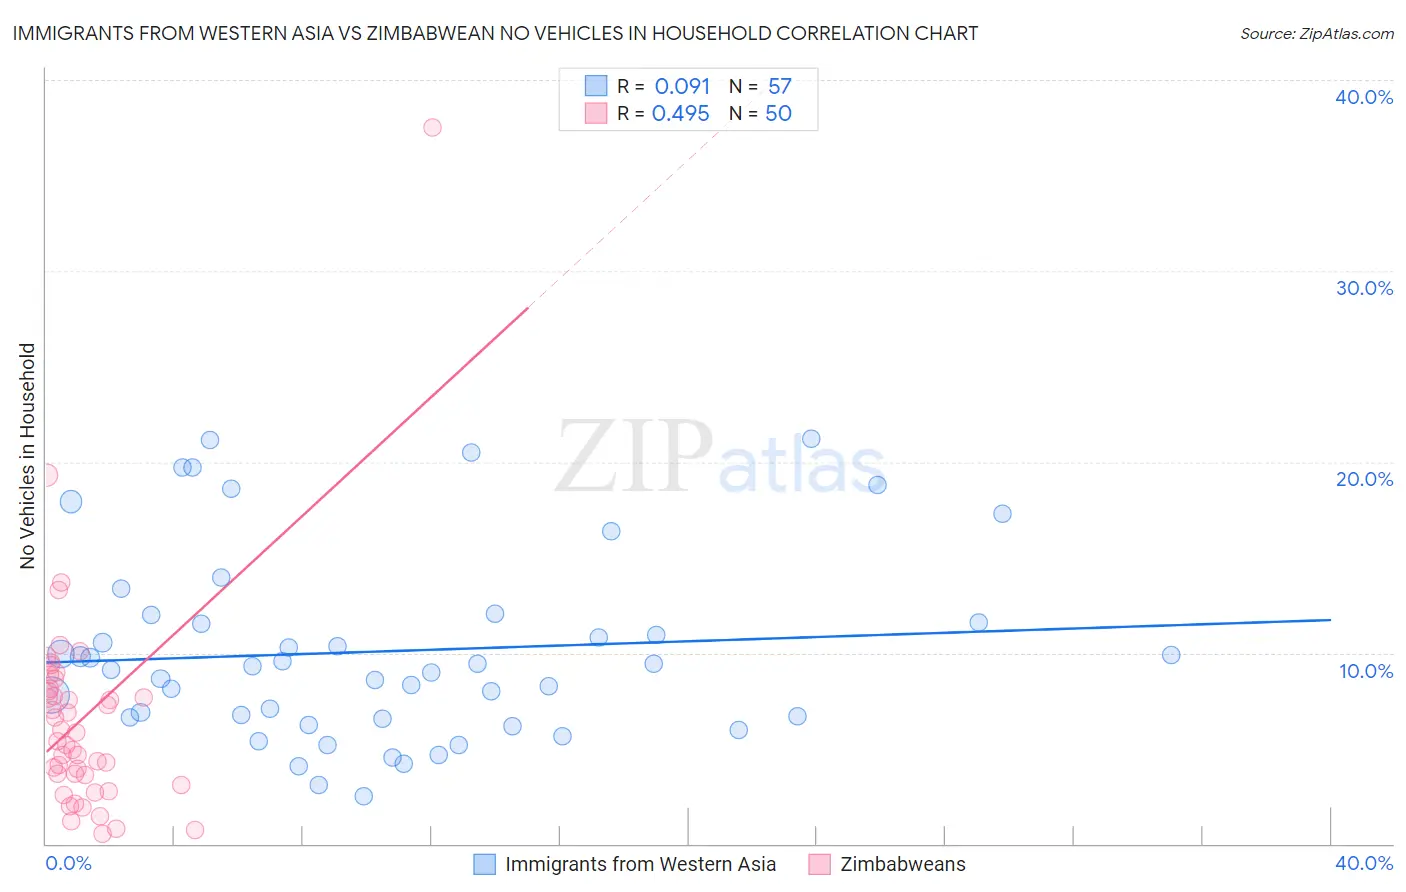
Immigrants from Western Asia vs Zimbabwean No Vehicles in Household Correlation Chart
The statistical analysis conducted on geographies consisting of 403,545,957 people shows a slight positive correlation between the proportion of Immigrants from Western Asia and percentage of households with no vehicle available in the United States with a correlation coefficient (R) of 0.091 and weighted average of 11.0%. Similarly, the statistical analysis conducted on geographies consisting of 69,183,978 people shows a moderate positive correlation between the proportion of Zimbabweans and percentage of households with no vehicle available in the United States with a correlation coefficient (R) of 0.495 and weighted average of 9.0%, a difference of 22.2%.
No Vehicles in Household Correlation Summary
| Measurement | Immigrants from Western Asia | Zimbabwean |
| Minimum | 2.5% | 0.49% |
| Maximum | 21.2% | 37.5% |
| Range | 18.8% | 37.0% |
| Mean | 10.1% | 6.6% |
| Median | 9.3% | 5.6% |
| Interquartile 25% (IQ1) | 6.6% | 3.6% |
| Interquartile 75% (IQ3) | 11.8% | 8.1% |
| Interquartile Range (IQR) | 5.2% | 4.5% |
| Standard Deviation (Sample) | 4.9% | 5.8% |
| Standard Deviation (Population) | 4.9% | 5.7% |
Similar Demographics by No Vehicles in Household
Demographics Similar to Immigrants from Western Asia by No Vehicles in Household
In terms of no vehicles in household, the demographic groups most similar to Immigrants from Western Asia are Crow (11.0%, a difference of 0.090%), Apache (11.0%, a difference of 0.25%), Pennsylvania German (11.0%, a difference of 0.41%), Immigrants from Hungary (11.1%, a difference of 0.43%), and Immigrants from Italy (11.0%, a difference of 0.45%).
| Demographics | Rating | Rank | No Vehicles in Household |
| Immigrants | Chile | 15.9 /100 | #205 | Poor 11.0% |
| Somalis | 15.9 /100 | #206 | Poor 11.0% |
| Sierra Leoneans | 15.7 /100 | #207 | Poor 11.0% |
| Immigrants | Italy | 15.6 /100 | #208 | Poor 11.0% |
| Pennsylvania Germans | 15.5 /100 | #209 | Poor 11.0% |
| Apache | 14.8 /100 | #210 | Poor 11.0% |
| Crow | 14.2 /100 | #211 | Poor 11.0% |
| Immigrants | Western Asia | 13.9 /100 | #212 | Poor 11.0% |
| Immigrants | Hungary | 12.3 /100 | #213 | Poor 11.1% |
| Immigrants | Denmark | 12.1 /100 | #214 | Poor 11.1% |
| Immigrants | Sri Lanka | 10.6 /100 | #215 | Poor 11.2% |
| Immigrants | Argentina | 10.6 /100 | #216 | Poor 11.2% |
| Dutch West Indians | 10.2 /100 | #217 | Poor 11.2% |
| Immigrants | Guatemala | 10.0 /100 | #218 | Tragic 11.2% |
| Argentineans | 9.6 /100 | #219 | Tragic 11.2% |
Demographics Similar to Zimbabweans by No Vehicles in Household
In terms of no vehicles in household, the demographic groups most similar to Zimbabweans are Spanish American (9.1%, a difference of 0.16%), Laotian (9.1%, a difference of 0.25%), Hispanic or Latino (9.1%, a difference of 0.52%), Mexican American Indian (9.1%, a difference of 0.60%), and Seminole (9.0%, a difference of 0.63%).
| Demographics | Rating | Rank | No Vehicles in Household |
| Immigrants | Central America | 98.5 /100 | #97 | Exceptional 8.9% |
| Slavs | 98.4 /100 | #98 | Exceptional 9.0% |
| Bulgarians | 98.4 /100 | #99 | Exceptional 9.0% |
| Asians | 98.3 /100 | #100 | Exceptional 9.0% |
| Pakistanis | 98.3 /100 | #101 | Exceptional 9.0% |
| Yugoslavians | 98.3 /100 | #102 | Exceptional 9.0% |
| Seminole | 98.3 /100 | #103 | Exceptional 9.0% |
| Zimbabweans | 98.0 /100 | #104 | Exceptional 9.0% |
| Spanish Americans | 97.9 /100 | #105 | Exceptional 9.1% |
| Laotians | 97.8 /100 | #106 | Exceptional 9.1% |
| Hispanics or Latinos | 97.7 /100 | #107 | Exceptional 9.1% |
| Mexican American Indians | 97.6 /100 | #108 | Exceptional 9.1% |
| Maltese | 97.6 /100 | #109 | Exceptional 9.1% |
| Delaware | 97.2 /100 | #110 | Exceptional 9.2% |
| Immigrants | Kuwait | 95.1 /100 | #111 | Exceptional 9.4% |