Immigrants from Burma/Myanmar vs Central American No Vehicles in Household
COMPARE
Immigrants from Burma/Myanmar
Central American
No Vehicles in Household
No Vehicles in Household Comparison
Immigrants from Burma/Myanmar
Central Americans
10.4%
NO VEHICLES IN HOUSEHOLD
49.1/ 100
METRIC RATING
175th/ 347
METRIC RANK
10.8%
NO VEHICLES IN HOUSEHOLD
24.3/ 100
METRIC RATING
196th/ 347
METRIC RANK
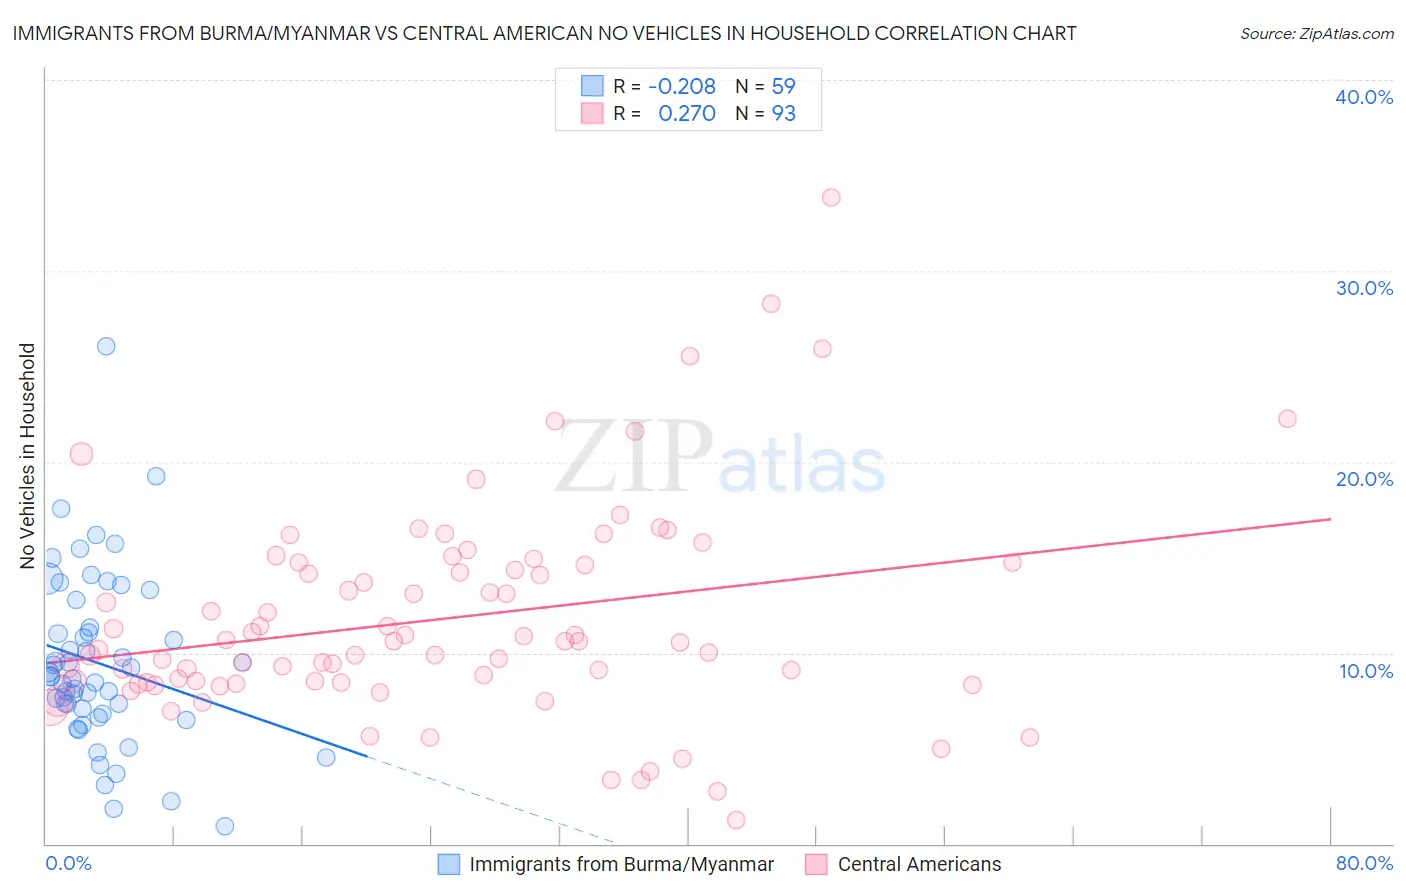
Immigrants from Burma/Myanmar vs Central American No Vehicles in Household Correlation Chart
The statistical analysis conducted on geographies consisting of 172,182,112 people shows a weak negative correlation between the proportion of Immigrants from Burma/Myanmar and percentage of households with no vehicle available in the United States with a correlation coefficient (R) of -0.208 and weighted average of 10.4%. Similarly, the statistical analysis conducted on geographies consisting of 502,389,156 people shows a weak positive correlation between the proportion of Central Americans and percentage of households with no vehicle available in the United States with a correlation coefficient (R) of 0.270 and weighted average of 10.8%, a difference of 3.7%.
No Vehicles in Household Correlation Summary
| Measurement | Immigrants from Burma/Myanmar | Central American |
| Minimum | 0.91% | 1.3% |
| Maximum | 26.1% | 33.8% |
| Range | 25.1% | 32.6% |
| Mean | 9.4% | 11.8% |
| Median | 8.8% | 10.6% |
| Interquartile 25% (IQ1) | 6.8% | 8.4% |
| Interquartile 75% (IQ3) | 11.3% | 14.7% |
| Interquartile Range (IQR) | 4.6% | 6.2% |
| Standard Deviation (Sample) | 4.5% | 5.5% |
| Standard Deviation (Population) | 4.5% | 5.5% |
Similar Demographics by No Vehicles in Household
Demographics Similar to Immigrants from Burma/Myanmar by No Vehicles in Household
In terms of no vehicles in household, the demographic groups most similar to Immigrants from Burma/Myanmar are French American Indian (10.4%, a difference of 0.0%), Immigrants from El Salvador (10.4%, a difference of 0.010%), Immigrants from Sudan (10.4%, a difference of 0.12%), Filipino (10.4%, a difference of 0.13%), and Immigrants from Ethiopia (10.4%, a difference of 0.16%).
| Demographics | Rating | Rank | No Vehicles in Household |
| Indonesians | 56.7 /100 | #168 | Average 10.3% |
| Lumbee | 54.7 /100 | #169 | Average 10.3% |
| Immigrants | Latin America | 53.2 /100 | #170 | Average 10.4% |
| Hmong | 52.7 /100 | #171 | Average 10.4% |
| Brazilians | 51.7 /100 | #172 | Average 10.4% |
| Filipinos | 50.1 /100 | #173 | Average 10.4% |
| Immigrants | Sudan | 50.0 /100 | #174 | Average 10.4% |
| Immigrants | Burma/Myanmar | 49.1 /100 | #175 | Average 10.4% |
| French American Indians | 49.1 /100 | #176 | Average 10.4% |
| Immigrants | El Salvador | 49.1 /100 | #177 | Average 10.4% |
| Immigrants | Ethiopia | 48.0 /100 | #178 | Average 10.4% |
| Ethiopians | 45.8 /100 | #179 | Average 10.5% |
| Arabs | 45.3 /100 | #180 | Average 10.5% |
| Immigrants | Colombia | 44.1 /100 | #181 | Average 10.5% |
| Immigrants | Bulgaria | 43.8 /100 | #182 | Average 10.5% |
Demographics Similar to Central Americans by No Vehicles in Household
In terms of no vehicles in household, the demographic groups most similar to Central Americans are Shoshone (10.8%, a difference of 0.040%), Immigrants from Sweden (10.8%, a difference of 0.25%), Immigrants from Brazil (10.8%, a difference of 0.34%), Pueblo (10.8%, a difference of 0.45%), and Immigrants from Asia (10.9%, a difference of 0.56%).
| Demographics | Rating | Rank | No Vehicles in Household |
| Immigrants | Eritrea | 36.3 /100 | #189 | Fair 10.6% |
| Immigrants | North Macedonia | 34.6 /100 | #190 | Fair 10.6% |
| Immigrants | Northern Europe | 33.1 /100 | #191 | Fair 10.7% |
| Carpatho Rusyns | 32.1 /100 | #192 | Fair 10.7% |
| Ukrainians | 28.0 /100 | #193 | Fair 10.7% |
| Pueblo | 27.0 /100 | #194 | Fair 10.8% |
| Immigrants | Brazil | 26.3 /100 | #195 | Fair 10.8% |
| Central Americans | 24.3 /100 | #196 | Fair 10.8% |
| Shoshone | 24.1 /100 | #197 | Fair 10.8% |
| Immigrants | Sweden | 22.9 /100 | #198 | Fair 10.8% |
| Immigrants | Asia | 21.3 /100 | #199 | Fair 10.9% |
| Cambodians | 19.6 /100 | #200 | Poor 10.9% |
| Immigrants | Western Europe | 19.1 /100 | #201 | Poor 10.9% |
| Romanians | 17.9 /100 | #202 | Poor 10.9% |
| Iroquois | 17.6 /100 | #203 | Poor 10.9% |