Salvadoran vs Zimbabwean No Vehicles in Household
COMPARE
Salvadoran
Zimbabwean
No Vehicles in Household
No Vehicles in Household Comparison
Salvadorans
Zimbabweans
10.1%
NO VEHICLES IN HOUSEHOLD
72.4/ 100
METRIC RATING
155th/ 347
METRIC RANK
9.0%
NO VEHICLES IN HOUSEHOLD
98.0/ 100
METRIC RATING
104th/ 347
METRIC RANK
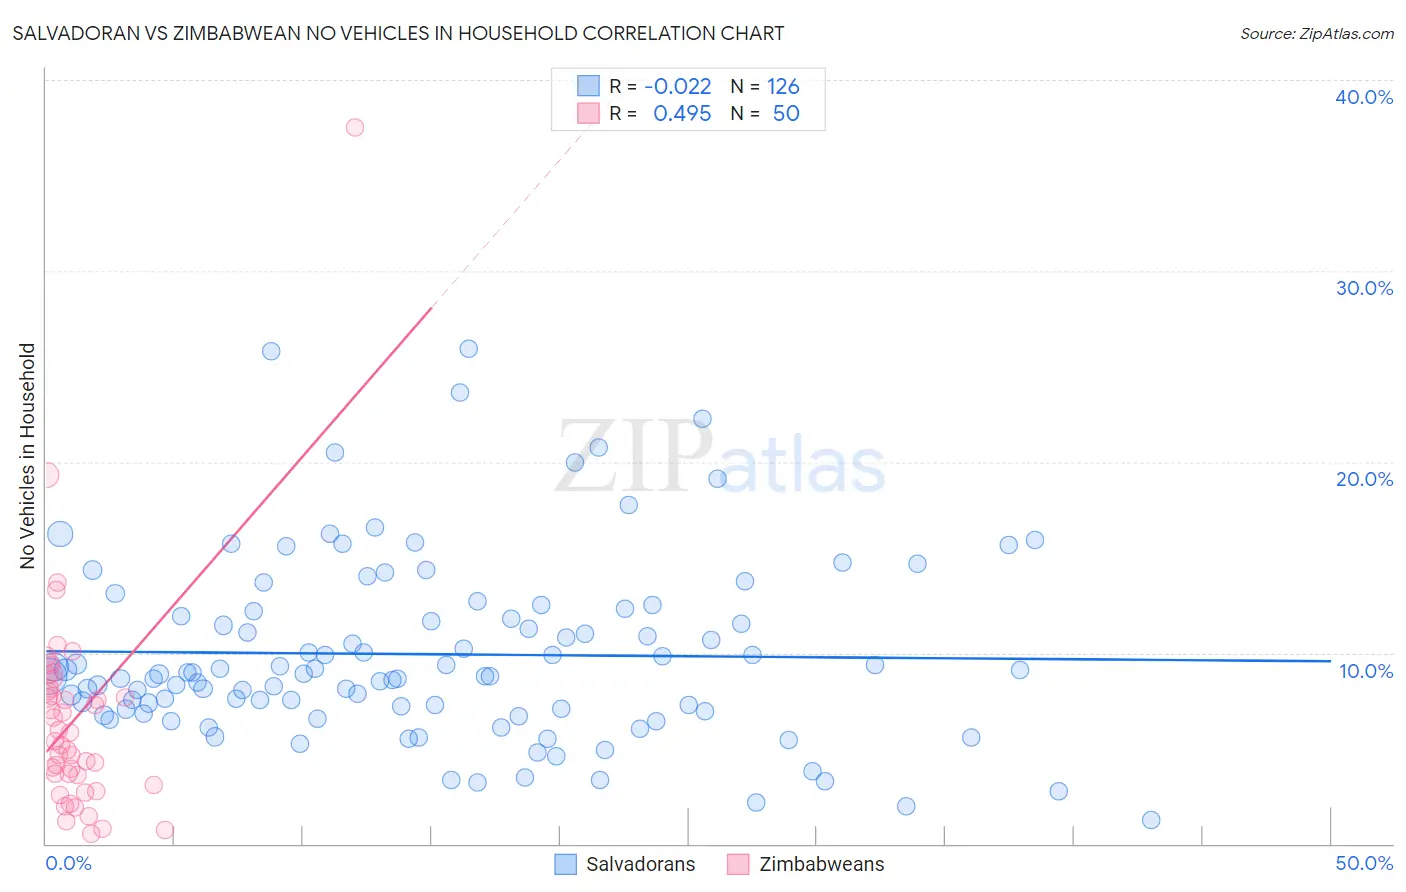
Salvadoran vs Zimbabwean No Vehicles in Household Correlation Chart
The statistical analysis conducted on geographies consisting of 397,977,733 people shows no correlation between the proportion of Salvadorans and percentage of households with no vehicle available in the United States with a correlation coefficient (R) of -0.022 and weighted average of 10.1%. Similarly, the statistical analysis conducted on geographies consisting of 69,183,978 people shows a moderate positive correlation between the proportion of Zimbabweans and percentage of households with no vehicle available in the United States with a correlation coefficient (R) of 0.495 and weighted average of 9.0%, a difference of 11.4%.
No Vehicles in Household Correlation Summary
| Measurement | Salvadoran | Zimbabwean |
| Minimum | 1.3% | 0.49% |
| Maximum | 25.9% | 37.5% |
| Range | 24.7% | 37.0% |
| Mean | 9.9% | 6.6% |
| Median | 8.9% | 5.6% |
| Interquartile 25% (IQ1) | 7.1% | 3.6% |
| Interquartile 75% (IQ3) | 12.2% | 8.1% |
| Interquartile Range (IQR) | 5.1% | 4.5% |
| Standard Deviation (Sample) | 4.8% | 5.8% |
| Standard Deviation (Population) | 4.8% | 5.7% |
Similar Demographics by No Vehicles in Household
Demographics Similar to Salvadorans by No Vehicles in Household
In terms of no vehicles in household, the demographic groups most similar to Salvadorans are Sioux (10.1%, a difference of 0.010%), Tlingit-Haida (10.1%, a difference of 0.030%), Immigrants from Congo (10.1%, a difference of 0.12%), Immigrants from Micronesia (10.1%, a difference of 0.25%), and Immigrants from Eastern Africa (10.0%, a difference of 0.26%).
| Demographics | Rating | Rank | No Vehicles in Household |
| Immigrants | Bosnia and Herzegovina | 79.1 /100 | #148 | Good 9.9% |
| Immigrants | Uganda | 76.1 /100 | #149 | Good 10.0% |
| Colombians | 73.9 /100 | #150 | Good 10.0% |
| Immigrants | Eastern Africa | 73.8 /100 | #151 | Good 10.0% |
| Immigrants | Congo | 73.0 /100 | #152 | Good 10.1% |
| Tlingit-Haida | 72.5 /100 | #153 | Good 10.1% |
| Sioux | 72.4 /100 | #154 | Good 10.1% |
| Salvadorans | 72.4 /100 | #155 | Good 10.1% |
| Immigrants | Micronesia | 70.9 /100 | #156 | Good 10.1% |
| Australians | 70.6 /100 | #157 | Good 10.1% |
| Spanish American Indians | 70.2 /100 | #158 | Good 10.1% |
| Immigrants | Indonesia | 69.3 /100 | #159 | Good 10.1% |
| Immigrants | Middle Africa | 65.7 /100 | #160 | Good 10.2% |
| New Zealanders | 65.1 /100 | #161 | Good 10.2% |
| Immigrants | Austria | 64.4 /100 | #162 | Good 10.2% |
Demographics Similar to Zimbabweans by No Vehicles in Household
In terms of no vehicles in household, the demographic groups most similar to Zimbabweans are Spanish American (9.1%, a difference of 0.16%), Laotian (9.1%, a difference of 0.25%), Hispanic or Latino (9.1%, a difference of 0.52%), Mexican American Indian (9.1%, a difference of 0.60%), and Seminole (9.0%, a difference of 0.63%).
| Demographics | Rating | Rank | No Vehicles in Household |
| Immigrants | Central America | 98.5 /100 | #97 | Exceptional 8.9% |
| Slavs | 98.4 /100 | #98 | Exceptional 9.0% |
| Bulgarians | 98.4 /100 | #99 | Exceptional 9.0% |
| Asians | 98.3 /100 | #100 | Exceptional 9.0% |
| Pakistanis | 98.3 /100 | #101 | Exceptional 9.0% |
| Yugoslavians | 98.3 /100 | #102 | Exceptional 9.0% |
| Seminole | 98.3 /100 | #103 | Exceptional 9.0% |
| Zimbabweans | 98.0 /100 | #104 | Exceptional 9.0% |
| Spanish Americans | 97.9 /100 | #105 | Exceptional 9.1% |
| Laotians | 97.8 /100 | #106 | Exceptional 9.1% |
| Hispanics or Latinos | 97.7 /100 | #107 | Exceptional 9.1% |
| Mexican American Indians | 97.6 /100 | #108 | Exceptional 9.1% |
| Maltese | 97.6 /100 | #109 | Exceptional 9.1% |
| Delaware | 97.2 /100 | #110 | Exceptional 9.2% |
| Immigrants | Kuwait | 95.1 /100 | #111 | Exceptional 9.4% |