Immigrants from Burma/Myanmar vs Zimbabwean Hearing Disability
COMPARE
Immigrants from Burma/Myanmar
Zimbabwean
Hearing Disability
Hearing Disability Comparison
Immigrants from Burma/Myanmar
Zimbabweans
2.9%
HEARING DISABILITY
69.5/ 100
METRIC RATING
158th/ 347
METRIC RANK
2.8%
HEARING DISABILITY
89.9/ 100
METRIC RATING
118th/ 347
METRIC RANK
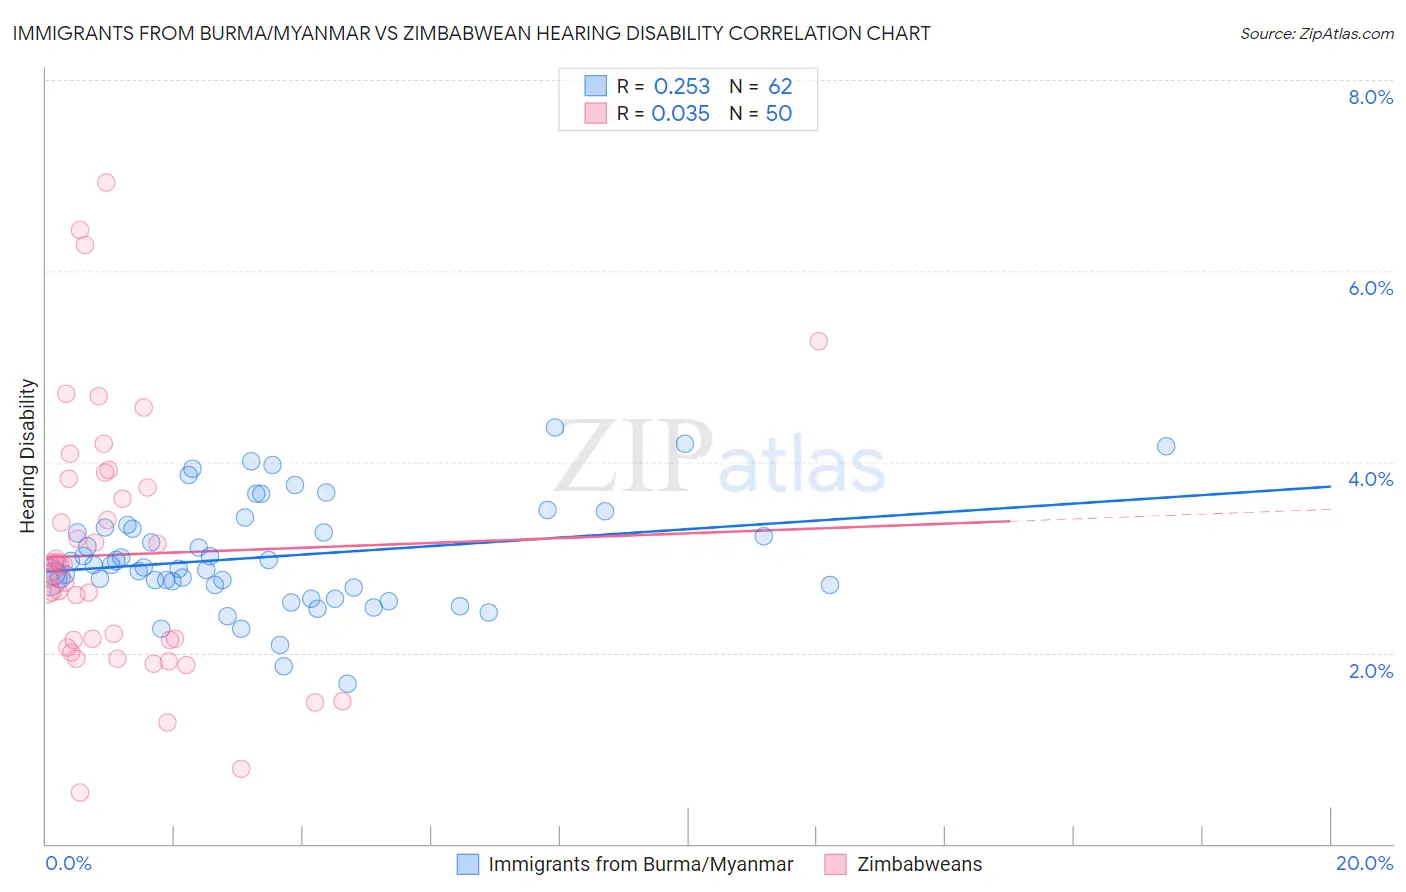
Immigrants from Burma/Myanmar vs Zimbabwean Hearing Disability Correlation Chart
The statistical analysis conducted on geographies consisting of 172,316,169 people shows a weak positive correlation between the proportion of Immigrants from Burma/Myanmar and percentage of population with hearing disability in the United States with a correlation coefficient (R) of 0.253 and weighted average of 2.9%. Similarly, the statistical analysis conducted on geographies consisting of 69,200,821 people shows no correlation between the proportion of Zimbabweans and percentage of population with hearing disability in the United States with a correlation coefficient (R) of 0.035 and weighted average of 2.8%, a difference of 3.4%.
Hearing Disability Correlation Summary
| Measurement | Immigrants from Burma/Myanmar | Zimbabwean |
| Minimum | 1.7% | 0.53% |
| Maximum | 4.4% | 6.9% |
| Range | 2.7% | 6.4% |
| Mean | 3.0% | 3.0% |
| Median | 2.9% | 2.9% |
| Interquartile 25% (IQ1) | 2.7% | 2.1% |
| Interquartile 75% (IQ3) | 3.3% | 3.7% |
| Interquartile Range (IQR) | 0.60% | 1.6% |
| Standard Deviation (Sample) | 0.56% | 1.3% |
| Standard Deviation (Population) | 0.56% | 1.3% |
Similar Demographics by Hearing Disability
Demographics Similar to Immigrants from Burma/Myanmar by Hearing Disability
In terms of hearing disability, the demographic groups most similar to Immigrants from Burma/Myanmar are Immigrants from Kazakhstan (2.9%, a difference of 0.010%), Immigrants from Poland (2.9%, a difference of 0.080%), Costa Rican (2.9%, a difference of 0.22%), Immigrants from Lebanon (2.9%, a difference of 0.23%), and Immigrants from Australia (2.9%, a difference of 0.23%).
| Demographics | Rating | Rank | Hearing Disability |
| Immigrants | France | 73.1 /100 | #151 | Good 2.9% |
| Immigrants | Lithuania | 73.0 /100 | #152 | Good 2.9% |
| Sudanese | 72.1 /100 | #153 | Good 2.9% |
| Immigrants | Lebanon | 71.5 /100 | #154 | Good 2.9% |
| Costa Ricans | 71.4 /100 | #155 | Good 2.9% |
| Immigrants | Poland | 70.2 /100 | #156 | Good 2.9% |
| Immigrants | Kazakhstan | 69.6 /100 | #157 | Good 2.9% |
| Immigrants | Burma/Myanmar | 69.5 /100 | #158 | Good 2.9% |
| Immigrants | Australia | 67.4 /100 | #159 | Good 2.9% |
| Immigrants | Fiji | 67.1 /100 | #160 | Good 2.9% |
| Albanians | 66.6 /100 | #161 | Good 2.9% |
| Immigrants | Japan | 66.3 /100 | #162 | Good 2.9% |
| Immigrants | Central America | 64.9 /100 | #163 | Good 3.0% |
| Immigrants | Cambodia | 64.8 /100 | #164 | Good 3.0% |
| Immigrants | Zimbabwe | 64.2 /100 | #165 | Good 3.0% |
Demographics Similar to Zimbabweans by Hearing Disability
In terms of hearing disability, the demographic groups most similar to Zimbabweans are Immigrants from Liberia (2.8%, a difference of 0.010%), Kenyan (2.8%, a difference of 0.020%), Immigrants (2.8%, a difference of 0.10%), Jordanian (2.8%, a difference of 0.11%), and Cuban (2.8%, a difference of 0.14%).
| Demographics | Rating | Rank | Hearing Disability |
| Immigrants | Yemen | 92.7 /100 | #111 | Exceptional 2.8% |
| U.S. Virgin Islanders | 92.5 /100 | #112 | Exceptional 2.8% |
| Immigrants | Belarus | 91.6 /100 | #113 | Exceptional 2.8% |
| Cambodians | 91.1 /100 | #114 | Exceptional 2.8% |
| Immigrants | Latin America | 90.5 /100 | #115 | Exceptional 2.8% |
| Immigrants | Immigrants | 90.3 /100 | #116 | Exceptional 2.8% |
| Immigrants | Liberia | 90.0 /100 | #117 | Excellent 2.8% |
| Zimbabweans | 89.9 /100 | #118 | Excellent 2.8% |
| Kenyans | 89.8 /100 | #119 | Excellent 2.8% |
| Jordanians | 89.5 /100 | #120 | Excellent 2.8% |
| Cubans | 89.4 /100 | #121 | Excellent 2.8% |
| Liberians | 89.0 /100 | #122 | Excellent 2.8% |
| Immigrants | Zaire | 88.6 /100 | #123 | Excellent 2.9% |
| Bahamians | 88.6 /100 | #124 | Excellent 2.9% |
| Immigrants | Albania | 88.5 /100 | #125 | Excellent 2.9% |