Delaware vs Immigrants from Cameroon 3 or more Vehicles in Household
COMPARE
Delaware
Immigrants from Cameroon
3 or more Vehicles in Household
3 or more Vehicles in Household Comparison
Delaware
Immigrants from Cameroon
21.5%
3 OR MORE VEHICLES IN HOUSEHOLD
99.6/ 100
METRIC RATING
86th/ 347
METRIC RANK
19.7%
3 OR MORE VEHICLES IN HOUSEHOLD
60.9/ 100
METRIC RATING
166th/ 347
METRIC RANK
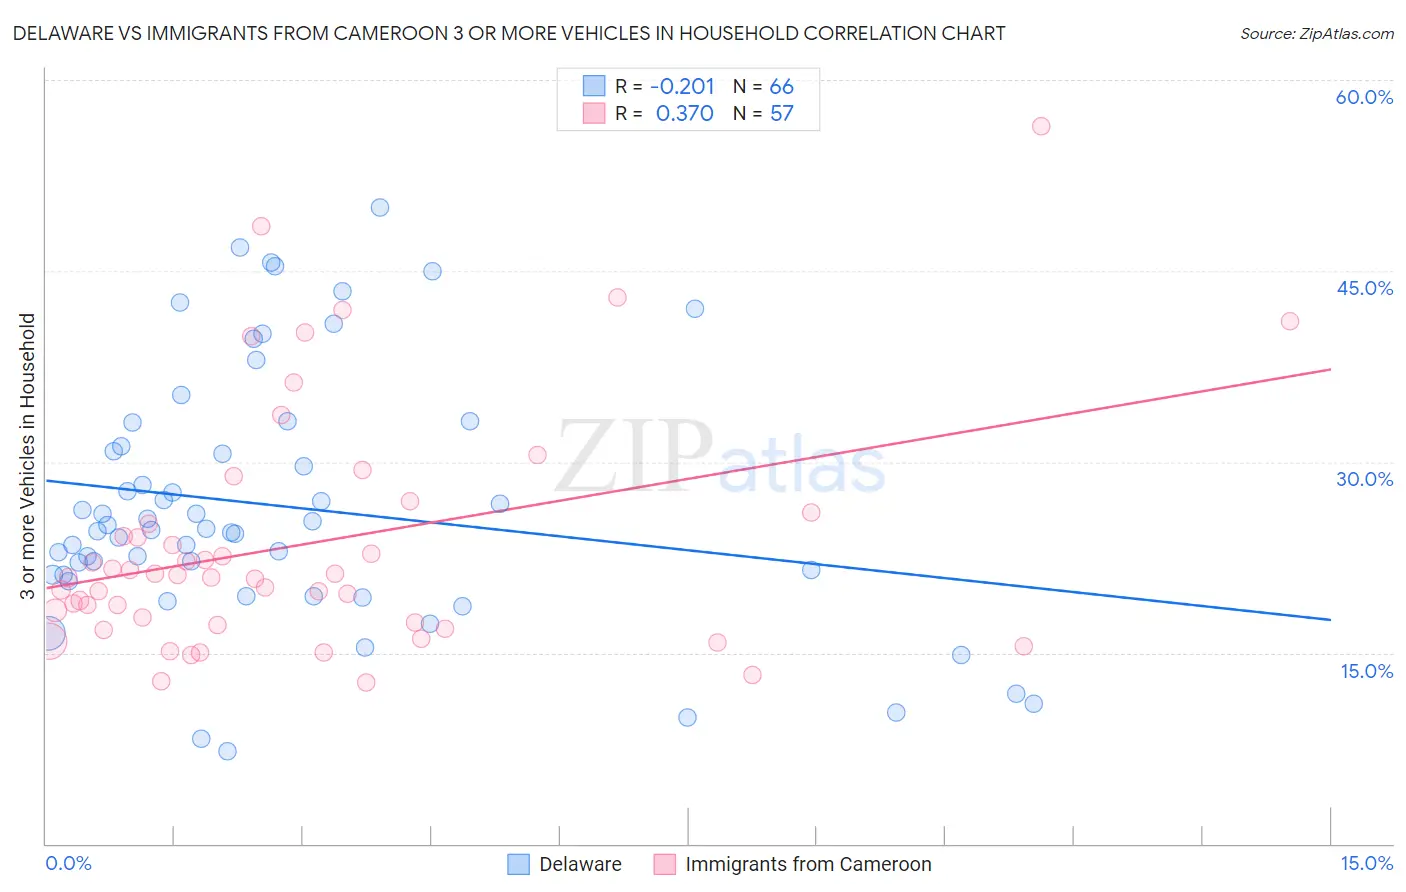
Delaware vs Immigrants from Cameroon 3 or more Vehicles in Household Correlation Chart
The statistical analysis conducted on geographies consisting of 96,224,171 people shows a weak negative correlation between the proportion of Delaware and percentage of households with 3 or more vehicles available in the United States with a correlation coefficient (R) of -0.201 and weighted average of 21.5%. Similarly, the statistical analysis conducted on geographies consisting of 130,731,455 people shows a mild positive correlation between the proportion of Immigrants from Cameroon and percentage of households with 3 or more vehicles available in the United States with a correlation coefficient (R) of 0.370 and weighted average of 19.7%, a difference of 9.3%.
3 or more Vehicles in Household Correlation Summary
| Measurement | Delaware | Immigrants from Cameroon |
| Minimum | 7.2% | 12.6% |
| Maximum | 50.0% | 56.3% |
| Range | 42.8% | 43.7% |
| Mean | 26.5% | 23.5% |
| Median | 24.7% | 20.9% |
| Interquartile 25% (IQ1) | 21.1% | 17.3% |
| Interquartile 75% (IQ3) | 31.3% | 25.6% |
| Interquartile Range (IQR) | 10.1% | 8.3% |
| Standard Deviation (Sample) | 10.0% | 9.4% |
| Standard Deviation (Population) | 9.9% | 9.3% |
Similar Demographics by 3 or more Vehicles in Household
Demographics Similar to Delaware by 3 or more Vehicles in Household
In terms of 3 or more vehicles in household, the demographic groups most similar to Delaware are Laotian (21.5%, a difference of 0.080%), Icelander (21.5%, a difference of 0.090%), Immigrants from the Azores (21.5%, a difference of 0.12%), Chippewa (21.5%, a difference of 0.14%), and Immigrants from El Salvador (21.5%, a difference of 0.17%).
| Demographics | Rating | Rank | 3 or more Vehicles in Household |
| Assyrians/Chaldeans/Syriacs | 99.8 /100 | #79 | Exceptional 21.7% |
| Afghans | 99.7 /100 | #80 | Exceptional 21.7% |
| Celtics | 99.7 /100 | #81 | Exceptional 21.7% |
| Immigrants | El Salvador | 99.6 /100 | #82 | Exceptional 21.5% |
| Chippewa | 99.6 /100 | #83 | Exceptional 21.5% |
| Icelanders | 99.6 /100 | #84 | Exceptional 21.5% |
| Laotians | 99.6 /100 | #85 | Exceptional 21.5% |
| Delaware | 99.6 /100 | #86 | Exceptional 21.5% |
| Immigrants | Azores | 99.5 /100 | #87 | Exceptional 21.5% |
| French | 99.4 /100 | #88 | Exceptional 21.4% |
| Marshallese | 99.2 /100 | #89 | Exceptional 21.3% |
| Immigrants | Afghanistan | 99.1 /100 | #90 | Exceptional 21.2% |
| Belgians | 98.9 /100 | #91 | Exceptional 21.2% |
| Apache | 98.9 /100 | #92 | Exceptional 21.2% |
| Immigrants | Indonesia | 98.8 /100 | #93 | Exceptional 21.1% |
Demographics Similar to Immigrants from Cameroon by 3 or more Vehicles in Household
In terms of 3 or more vehicles in household, the demographic groups most similar to Immigrants from Cameroon are Immigrants from Costa Rica (19.7%, a difference of 0.080%), Yugoslavian (19.7%, a difference of 0.16%), Ukrainian (19.6%, a difference of 0.16%), Chilean (19.7%, a difference of 0.17%), and Peruvian (19.6%, a difference of 0.17%).
| Demographics | Rating | Rank | 3 or more Vehicles in Household |
| Immigrants | Pakistan | 68.2 /100 | #159 | Good 19.8% |
| Immigrants | Lebanon | 67.6 /100 | #160 | Good 19.8% |
| Immigrants | Guatemala | 65.6 /100 | #161 | Good 19.7% |
| Estonians | 63.2 /100 | #162 | Good 19.7% |
| Chileans | 63.0 /100 | #163 | Good 19.7% |
| Yugoslavians | 62.9 /100 | #164 | Good 19.7% |
| Immigrants | Costa Rica | 61.9 /100 | #165 | Good 19.7% |
| Immigrants | Cameroon | 60.9 /100 | #166 | Good 19.7% |
| Ukrainians | 58.9 /100 | #167 | Average 19.6% |
| Peruvians | 58.8 /100 | #168 | Average 19.6% |
| Immigrants | Denmark | 57.6 /100 | #169 | Average 19.6% |
| Iraqis | 56.0 /100 | #170 | Average 19.6% |
| Immigrants | Western Europe | 53.2 /100 | #171 | Average 19.5% |
| Kiowa | 50.9 /100 | #172 | Average 19.5% |
| Immigrants | Northern Europe | 50.2 /100 | #173 | Average 19.5% |