Israeli vs Immigrants from Cameroon 3 or more Vehicles in Household
COMPARE
Israeli
Immigrants from Cameroon
3 or more Vehicles in Household
3 or more Vehicles in Household Comparison
Israelis
Immigrants from Cameroon
16.8%
3 OR MORE VEHICLES IN HOUSEHOLD
0.1/ 100
METRIC RATING
297th/ 347
METRIC RANK
19.7%
3 OR MORE VEHICLES IN HOUSEHOLD
60.9/ 100
METRIC RATING
166th/ 347
METRIC RANK
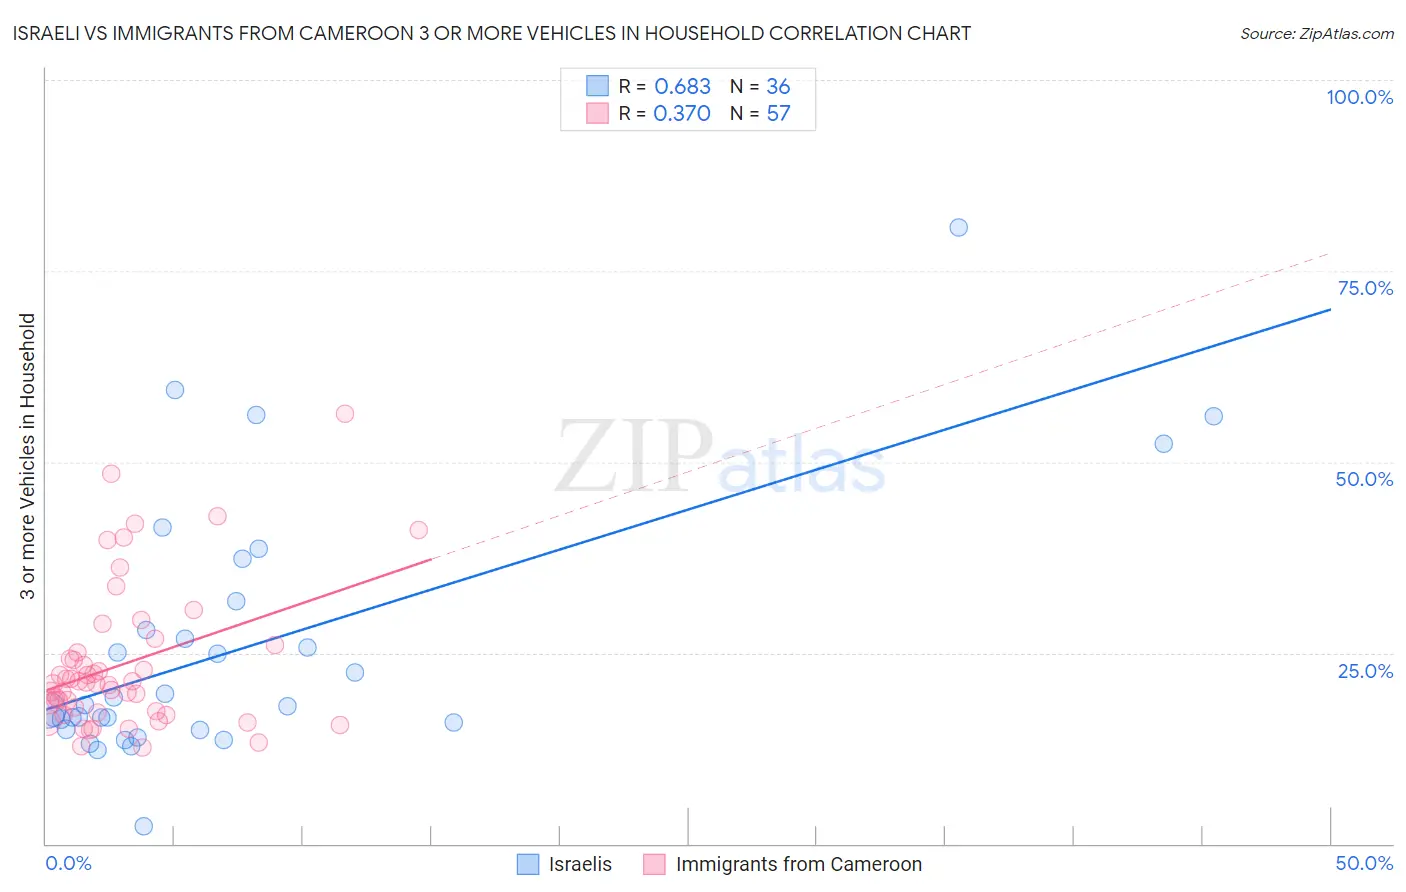
Israeli vs Immigrants from Cameroon 3 or more Vehicles in Household Correlation Chart
The statistical analysis conducted on geographies consisting of 210,927,283 people shows a significant positive correlation between the proportion of Israelis and percentage of households with 3 or more vehicles available in the United States with a correlation coefficient (R) of 0.683 and weighted average of 16.8%. Similarly, the statistical analysis conducted on geographies consisting of 130,731,455 people shows a mild positive correlation between the proportion of Immigrants from Cameroon and percentage of households with 3 or more vehicles available in the United States with a correlation coefficient (R) of 0.370 and weighted average of 19.7%, a difference of 17.2%.
3 or more Vehicles in Household Correlation Summary
| Measurement | Israeli | Immigrants from Cameroon |
| Minimum | 2.3% | 12.6% |
| Maximum | 80.8% | 56.3% |
| Range | 78.4% | 43.7% |
| Mean | 25.7% | 23.5% |
| Median | 18.1% | 20.9% |
| Interquartile 25% (IQ1) | 15.5% | 17.3% |
| Interquartile 75% (IQ3) | 29.9% | 25.6% |
| Interquartile Range (IQR) | 14.4% | 8.3% |
| Standard Deviation (Sample) | 16.8% | 9.4% |
| Standard Deviation (Population) | 16.6% | 9.3% |
Similar Demographics by 3 or more Vehicles in Household
Demographics Similar to Israelis by 3 or more Vehicles in Household
In terms of 3 or more vehicles in household, the demographic groups most similar to Israelis are Immigrants from Zaire (16.7%, a difference of 0.37%), Immigrants from South America (16.7%, a difference of 0.43%), Inupiat (16.9%, a difference of 0.47%), Immigrants from Russia (16.9%, a difference of 0.83%), and Immigrants from Western Africa (16.9%, a difference of 0.88%).
| Demographics | Rating | Rank | 3 or more Vehicles in Household |
| Liberians | 0.1 /100 | #290 | Tragic 17.0% |
| Immigrants | Congo | 0.1 /100 | #291 | Tragic 17.0% |
| Immigrants | Spain | 0.1 /100 | #292 | Tragic 17.0% |
| Bahamians | 0.1 /100 | #293 | Tragic 16.9% |
| Immigrants | Western Africa | 0.1 /100 | #294 | Tragic 16.9% |
| Immigrants | Russia | 0.1 /100 | #295 | Tragic 16.9% |
| Inupiat | 0.1 /100 | #296 | Tragic 16.9% |
| Israelis | 0.1 /100 | #297 | Tragic 16.8% |
| Immigrants | Zaire | 0.1 /100 | #298 | Tragic 16.7% |
| Immigrants | South America | 0.1 /100 | #299 | Tragic 16.7% |
| Cypriots | 0.0 /100 | #300 | Tragic 16.6% |
| Paraguayans | 0.0 /100 | #301 | Tragic 16.6% |
| Immigrants | Greece | 0.0 /100 | #302 | Tragic 16.5% |
| Immigrants | Serbia | 0.0 /100 | #303 | Tragic 16.4% |
| Ghanaians | 0.0 /100 | #304 | Tragic 16.4% |
Demographics Similar to Immigrants from Cameroon by 3 or more Vehicles in Household
In terms of 3 or more vehicles in household, the demographic groups most similar to Immigrants from Cameroon are Immigrants from Costa Rica (19.7%, a difference of 0.080%), Yugoslavian (19.7%, a difference of 0.16%), Ukrainian (19.6%, a difference of 0.16%), Chilean (19.7%, a difference of 0.17%), and Peruvian (19.6%, a difference of 0.17%).
| Demographics | Rating | Rank | 3 or more Vehicles in Household |
| Immigrants | Pakistan | 68.2 /100 | #159 | Good 19.8% |
| Immigrants | Lebanon | 67.6 /100 | #160 | Good 19.8% |
| Immigrants | Guatemala | 65.6 /100 | #161 | Good 19.7% |
| Estonians | 63.2 /100 | #162 | Good 19.7% |
| Chileans | 63.0 /100 | #163 | Good 19.7% |
| Yugoslavians | 62.9 /100 | #164 | Good 19.7% |
| Immigrants | Costa Rica | 61.9 /100 | #165 | Good 19.7% |
| Immigrants | Cameroon | 60.9 /100 | #166 | Good 19.7% |
| Ukrainians | 58.9 /100 | #167 | Average 19.6% |
| Peruvians | 58.8 /100 | #168 | Average 19.6% |
| Immigrants | Denmark | 57.6 /100 | #169 | Average 19.6% |
| Iraqis | 56.0 /100 | #170 | Average 19.6% |
| Immigrants | Western Europe | 53.2 /100 | #171 | Average 19.5% |
| Kiowa | 50.9 /100 | #172 | Average 19.5% |
| Immigrants | Northern Europe | 50.2 /100 | #173 | Average 19.5% |